
Introduction
This document uses the voter list data for conducting a demographic analysis of Bangalore.
We will be using the ward wise age distribution data to check whether we can identify certain characteristics of the city.
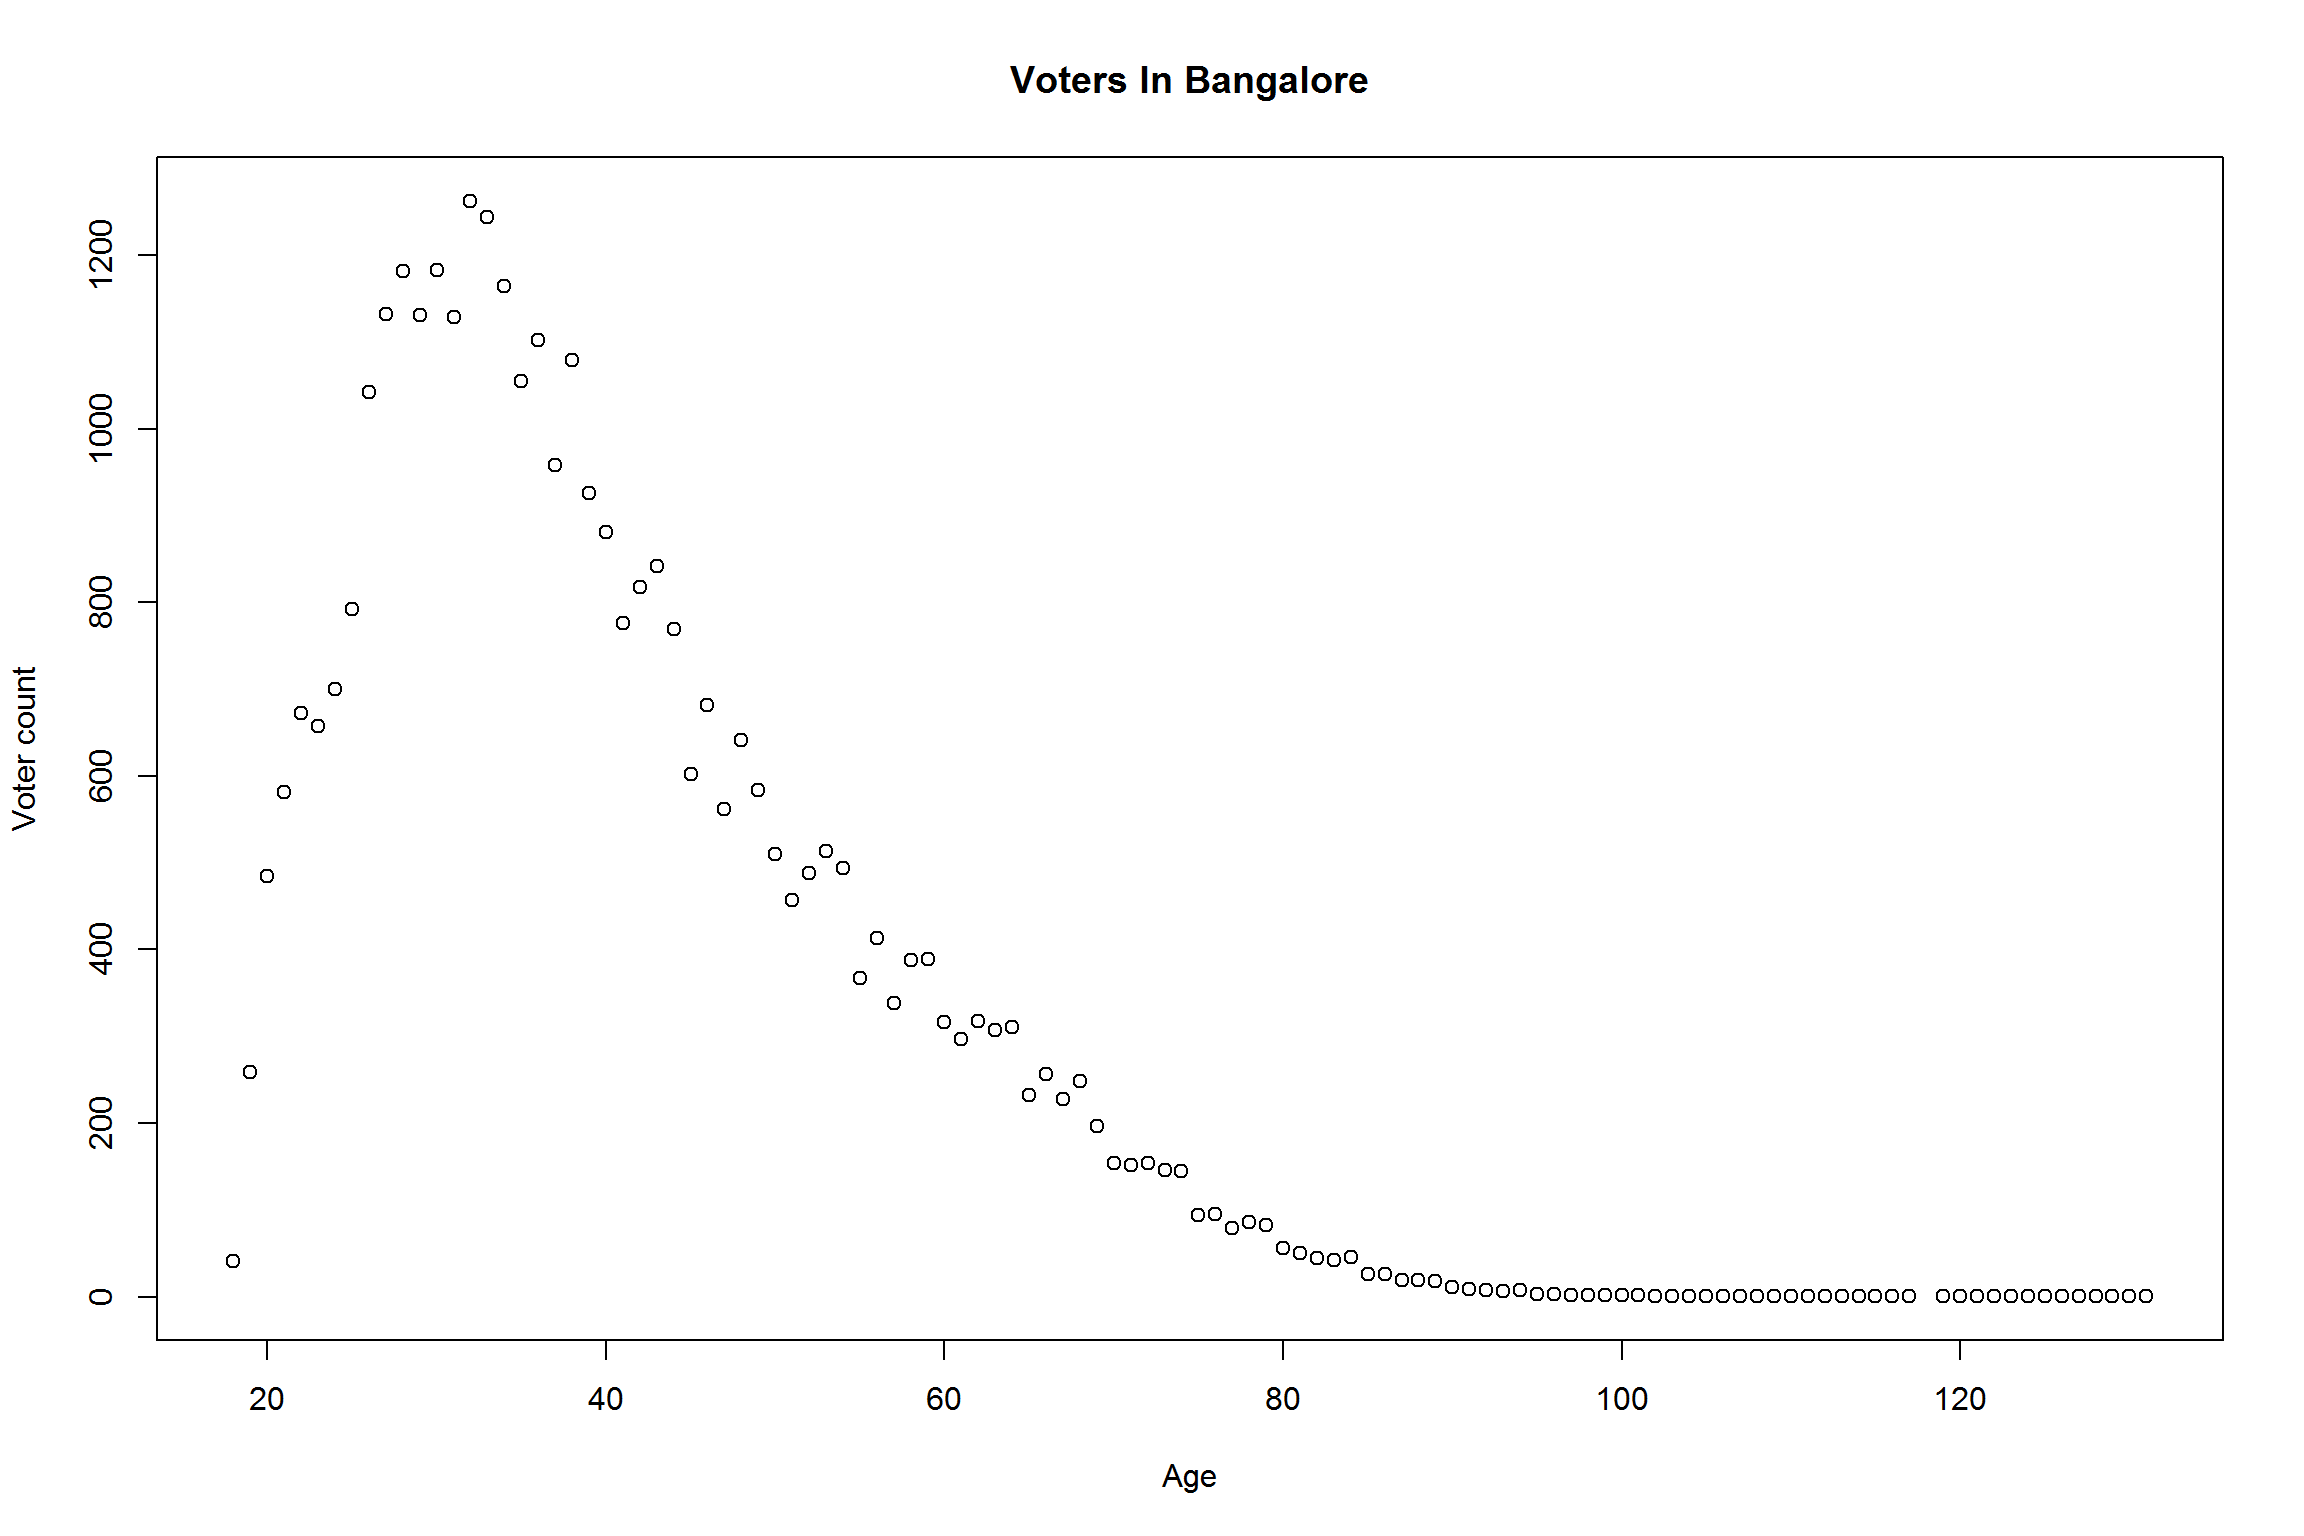
We see that overall across Bangalore the age distribution peaks at around 30-35 years and then gradually falls until 80.
As a first cut analysis to check the robustness of the data we will see whether we can identify demographic distribution across wards and correlate the distribution with supporting evidence.
We will try to statistically predict areas of Bangalore that are pensioners paradise, student enclaves, working singles, working families and migrant areas based on the voter data.
The different groupings are defined as follows.
- Students: Age group 18 to 22 yrs
- Working singles: 22 to 26(Women) 28(men) we will take an average of 27 as the upper bound
- Working families: 27 to 58 ** Further divided in IT Families (27 to 40), Mix families (40 to50) and Non IT Families (50 to 58)
- Retired Citizens: 58 to 62
- Senior Citizens 62+
- Migrant Areas:Large young working population with a spike around retirement age when parents relocate to be with the children.
Which groups contain interesting data?
We will be studying variance across wards for each demographic group. Our focus will to to study areas with high variance. The standard deviation across groups is,
##          name     sd
## 1    students 0.8000
## 2     singles 1.2507
## 3  ITfamilies 4.5826
## 4 SITfamilies 1.0352
## 5 NonITfamily 1.5821
## 6     retired 0.8361
## 7     seniors 3.3370
Checking the standard deviation for each of the identified groups across 198 wards, we find that the deviation for students and retired groups is very low across the wards.
It either means that they are uniformly distributed across the city, or in case of students, if there is a student enclave (around engineering schools, medical colleges, IISc and IIM’s) it is not showing up because outstation students have not registered in the local voters list.
We find high deviation for New families (27-40 age range) and senior citizens(62+) group.
Analyzing these two sets of data…
Where are the young families settling down?
The system tells us that young families are settling down in
- Mahadevapura(5 wards)
- Bommanahalli(4 wards)
- Dasarhalli (4 wards)
- Along with a few wards in the neighborhood of the above wards.
Checking on the map we see
- Mahadevapura contains various IT parks on Outer ring road between Kr Puram and Sarjapur, ITPL, Bagmane tech park.
- Dasarhalli contains the Peenya Industrial Area
- Bommanahalli is close to both ORR tech parks and Electronic city.
- Begur is close to electronic city.
So the presence of these job providers has resulted in increasing the density of young workers in these areas.
Why haven’t the new clusters like Manyata tech park shown up in this list? We may have to plot the relationship between setting up of a tech park and its influence in the community over time in order to predict the time required for these new tech park to change the demographic.
##     ward              Ward.Name Ward.Classification Assembly.Constituency
## 39    39           CHOKKASANDRA               Outer           Dasarahalli
## 40    40       Doddabidarakallu               Outer          Yeshwanthpur
## 41    41 PEENYA INDUSTRIAL AREA               Outer           Dasarahalli
## 42    42    LAKSHMI DEVI NAGARA               Inner  Rajarajeshwari Nagar
## 54    54                  HOODI               Outer          Mahadevapura
## 55    55             DEVASANDRA               Outer             K R Puram
## 69    69                LAGGERE               Inner  Rajarajeshwari Nagar
## 70    70         RAJGOPAL NAGAR               Outer           Dasarahalli
## 71    71           HEGGANAHALLI               Outer           Dasarahalli
## 82    82        GARUDACHARPALYA               Outer          Mahadevapura
## 83    83               KADUGODI               Outer          Mahadevapura
## 85    85           DODDANEKUNDI               Outer          Mahadevapura
## 102  102   VRISHABHAVATHI NAGAR               Inner    Mahalakshmi Layout
## 150  150              BELLANDUR               Outer          Mahadevapura
## 175  175           BOMMANAHALLI               Outer          Bommanahalli
## 188  188             BILEKHALLI               Outer          Bommanahalli
## 189  189            Hongasandra               Outer          Bommanahalli
## 190  190        MANGAMMANAPALYA               Outer          Bommanahalli
## 191  191            SINGASANDRA               Outer                Anekal
## 192  192                  BEGUR               Outer       Bangalore South
Where are the “Pensioners paradise?”
Bangalore was once upon a time known as pensioners paradise, so where exactly are the senior citizens settling down?
The data reports old Bangalore areas as the areas where citizens above 60 years are clustered.
## ward Ward.Name Ward.Classification Assembly.Constituency
## 19 19 SANJAYNAGAR Inner Hebbal
## 29 29 KACHARAKANAHALLI Inner Sarvagna Nagar
## 65 65 KADUMALLESWARA Inner Malleshwaram
## 66 66 SUBRAMANYANAGAR Inner Malleshwaram
## 67 67 NAGAPURA Inner Mahalakshmi Layout
## 78 78 Pulikeshinagar Inner Pulakeshinagar
## 80 80 HOYSALANAGAR Inner C V Raman Nagar
## 93 93 Vasanthanagar Inner Shivajinagar
## 111 111 Shantala Nagar Inner Shanthinagar
## 125 125 MARENAHALLI Inner Govindarajanagar
## 142 142 SUNKENAHALLI Inner Chikpet
## 151 151 KORAMANGALA Inner B T M Layout
## 154 154 BASAVANAGUDI Inner Basavanagudi
## 162 162 GIRINAGAR Inner Basavanagudi
## 165 165 GANESH MANDIR Inner Padmanabhanagar
## 167 167 YEDIYUR Inner Padmanabhanagar
## 168 168 PATTABHIRAMA NAGAR Inner Jayanagar
## 177 177 JP NAGAR Inner Jayanagar
## 178 178 SARAKKI Inner Jayanagar
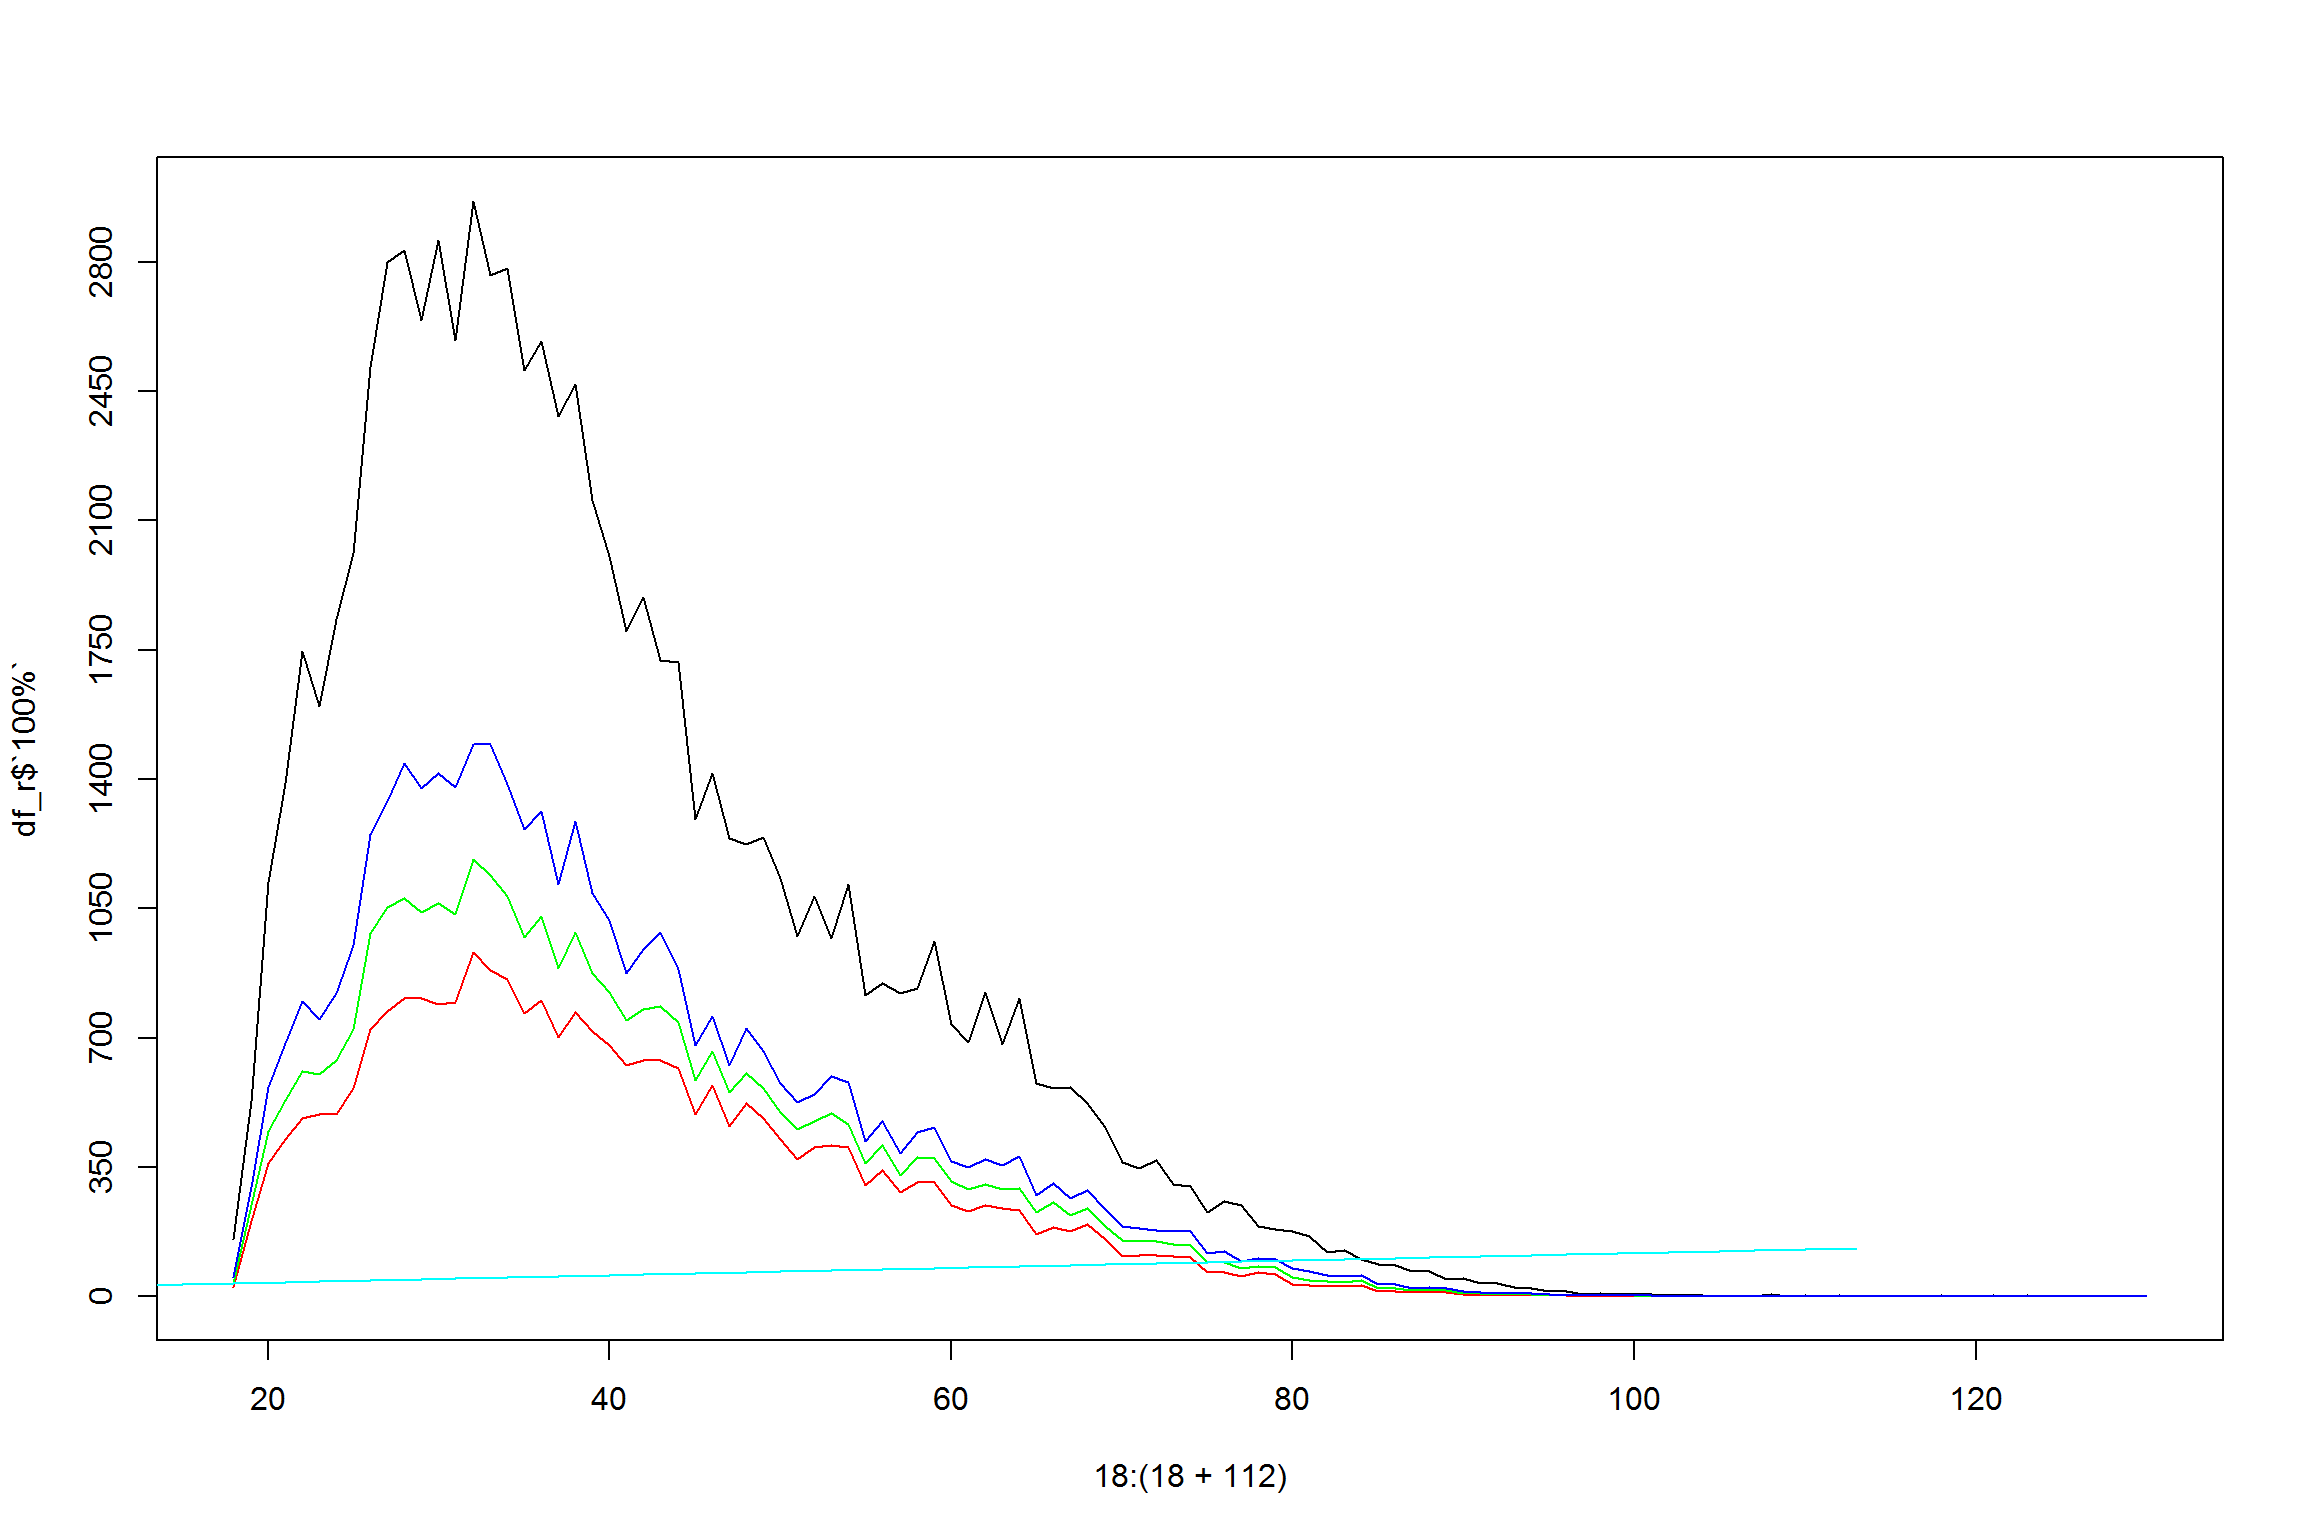
## 179 179 SHAKAMBARINAGAR Inner JayanagarMeasuring the quartiles across each ward we get
Conclusion and future work.
- Looking at historic trends can help us understand the impact of current activities over time.
- Breaking down the data to polling booth level will help understand whether student enclaves are missing due to non-registration or they are getting merged in the overall population.
- Areas which should have shown a deviation for a given demographic but is not, is an indicator for a dedicated voter registration effort by ECI.