
Introduction
This is an analysis of the voters list for Entire Bangalore city. The database consists of 4 years worth of voter records, each year has over 6 million records. For each voter the database captures the following fields.
| Field | Description |
|---|---|
| AC[0-9]+ | A combination of the AC and the part number |
| [0-9]+ | A 3 digit code |
| [0-9]+ | Serial number |
| [A-Z]+[0-9]+ | Voter ID Number a.k.a EPIC Number |
| [A-Z]+ | Voters Name |
| [FM] | Voters Gender |
| [0-9]+ | Voters Age |
| [A-Z]+ | Voters Relative’s Name |
| [FH] | Relationship with Relative |
| [A-Z] | Added/deleted/moved etc. |
Preprocessing.
R is not able to read the data and crashes with a memory limit message. So as a first step we will split each year’s data into separate AC wise data files. For the purpose of this experiment we will take the voter List released on Jan 2013 as our reference voter list.
Typical demographic analysis.
To validate the robustness of the dataset we can try to answer the following questions.
- IISc has only post grad students (all above 18 yrs) and most of them stay on Campus. Can I Identify the polling booths for IISc?
- Can I do something similar for IIM?
- Does voter registration take place in election year or does it take place every year?
- Organic growth areas should see addition of citizens at age 18 whereas migrant dominated growth areas should see addition of citizens at age 22+ can I locate the area’s?
- Plot of unmarried people vs Age. What is the mean age of marriage?
- Identification of PG Homes, Tenent complexes etc.
- How many houses are there in Bangalore?
Can we identify Speciality Educational Institutions?
Institutions like IIM, IIsc, Medical and Engineering colleges have a large number of out station students living in Hostel. As per the ECI Rule these students are eligible for Voters ID. The question we are trying to answer is, did they apply for and get their voter ID? Since the prof’s also live on campus we will assume a prof to student ratio of 1:20. Many of the Prof’s will also have their children staying with them so some of them may ‘leak’ into the student category. We will check the partwise ratio and compare it with the ratio for rest of the AC to determine the feasibility of identifying IISc Polling booths.
##      minage maxage type
## [1,] "20"   "27"   "Students"
## type part_max max part_min min
## 1 Students AC157024 80 AC157027 7.097Looking up the parts with high percentage of youth compared to citizens above 27 (AC157024=78% and AC157025= 46%) gives us MSR Hostel. So we did manage to find an educational institution, but not the one we expected to find.
Can we now find potential location for youth centers, Senior citizen facilities across Bangalore?
We define a youth center as a place having significant population in between 18 to 25, a senior citizen facility as a place having significant population above 58
The top 5 AC’s which have a concentration of youth’s in their part No’s are
##    part_max   max
## 23 AC176289 37.14
## 24 AC160097 37.91
## 25 AC152081 42.61
## 26 AC172092 49.15
## 27 AC157024 80.49
The bottom 5 AC’s which have a the lowest concentration of youth’s in their part No’s are
##   part_min    min
## 1 AC166191 0.6452
## 2 AC161005 1.2500
## 3 AC160135 1.3889
## 4 AC169133 2.0997
## 5 AC164003 2.2388
Similarly there are some areas where senior citizens form a major part of the voters and some areas without any senior citizens.
The top 5 AC’s which have a concentration of senior citizen’s in their part No’s are
##    part_max   max
## 23 AC159177 35.21
## 24 AC158099 35.29
## 25 AC161148 39.08
## 26 AC157092 41.79
## 27 AC160159 42.08
The bottom 5 AC’s which have a the lowest concentration of Senior’s in their part No’s are
##   part_min    min
## 1 AC174172 0.6494
## 2 AC176174 1.5365
## 3 AC155243 1.7214
## 4 AC175155 2.4010
## 5 AC172205 2.4590
Maritial Status
Since it is easier to detect maritial status of the female we will check for the age of marriage.
## "","x"
## "1","ac_maritial_status.csv"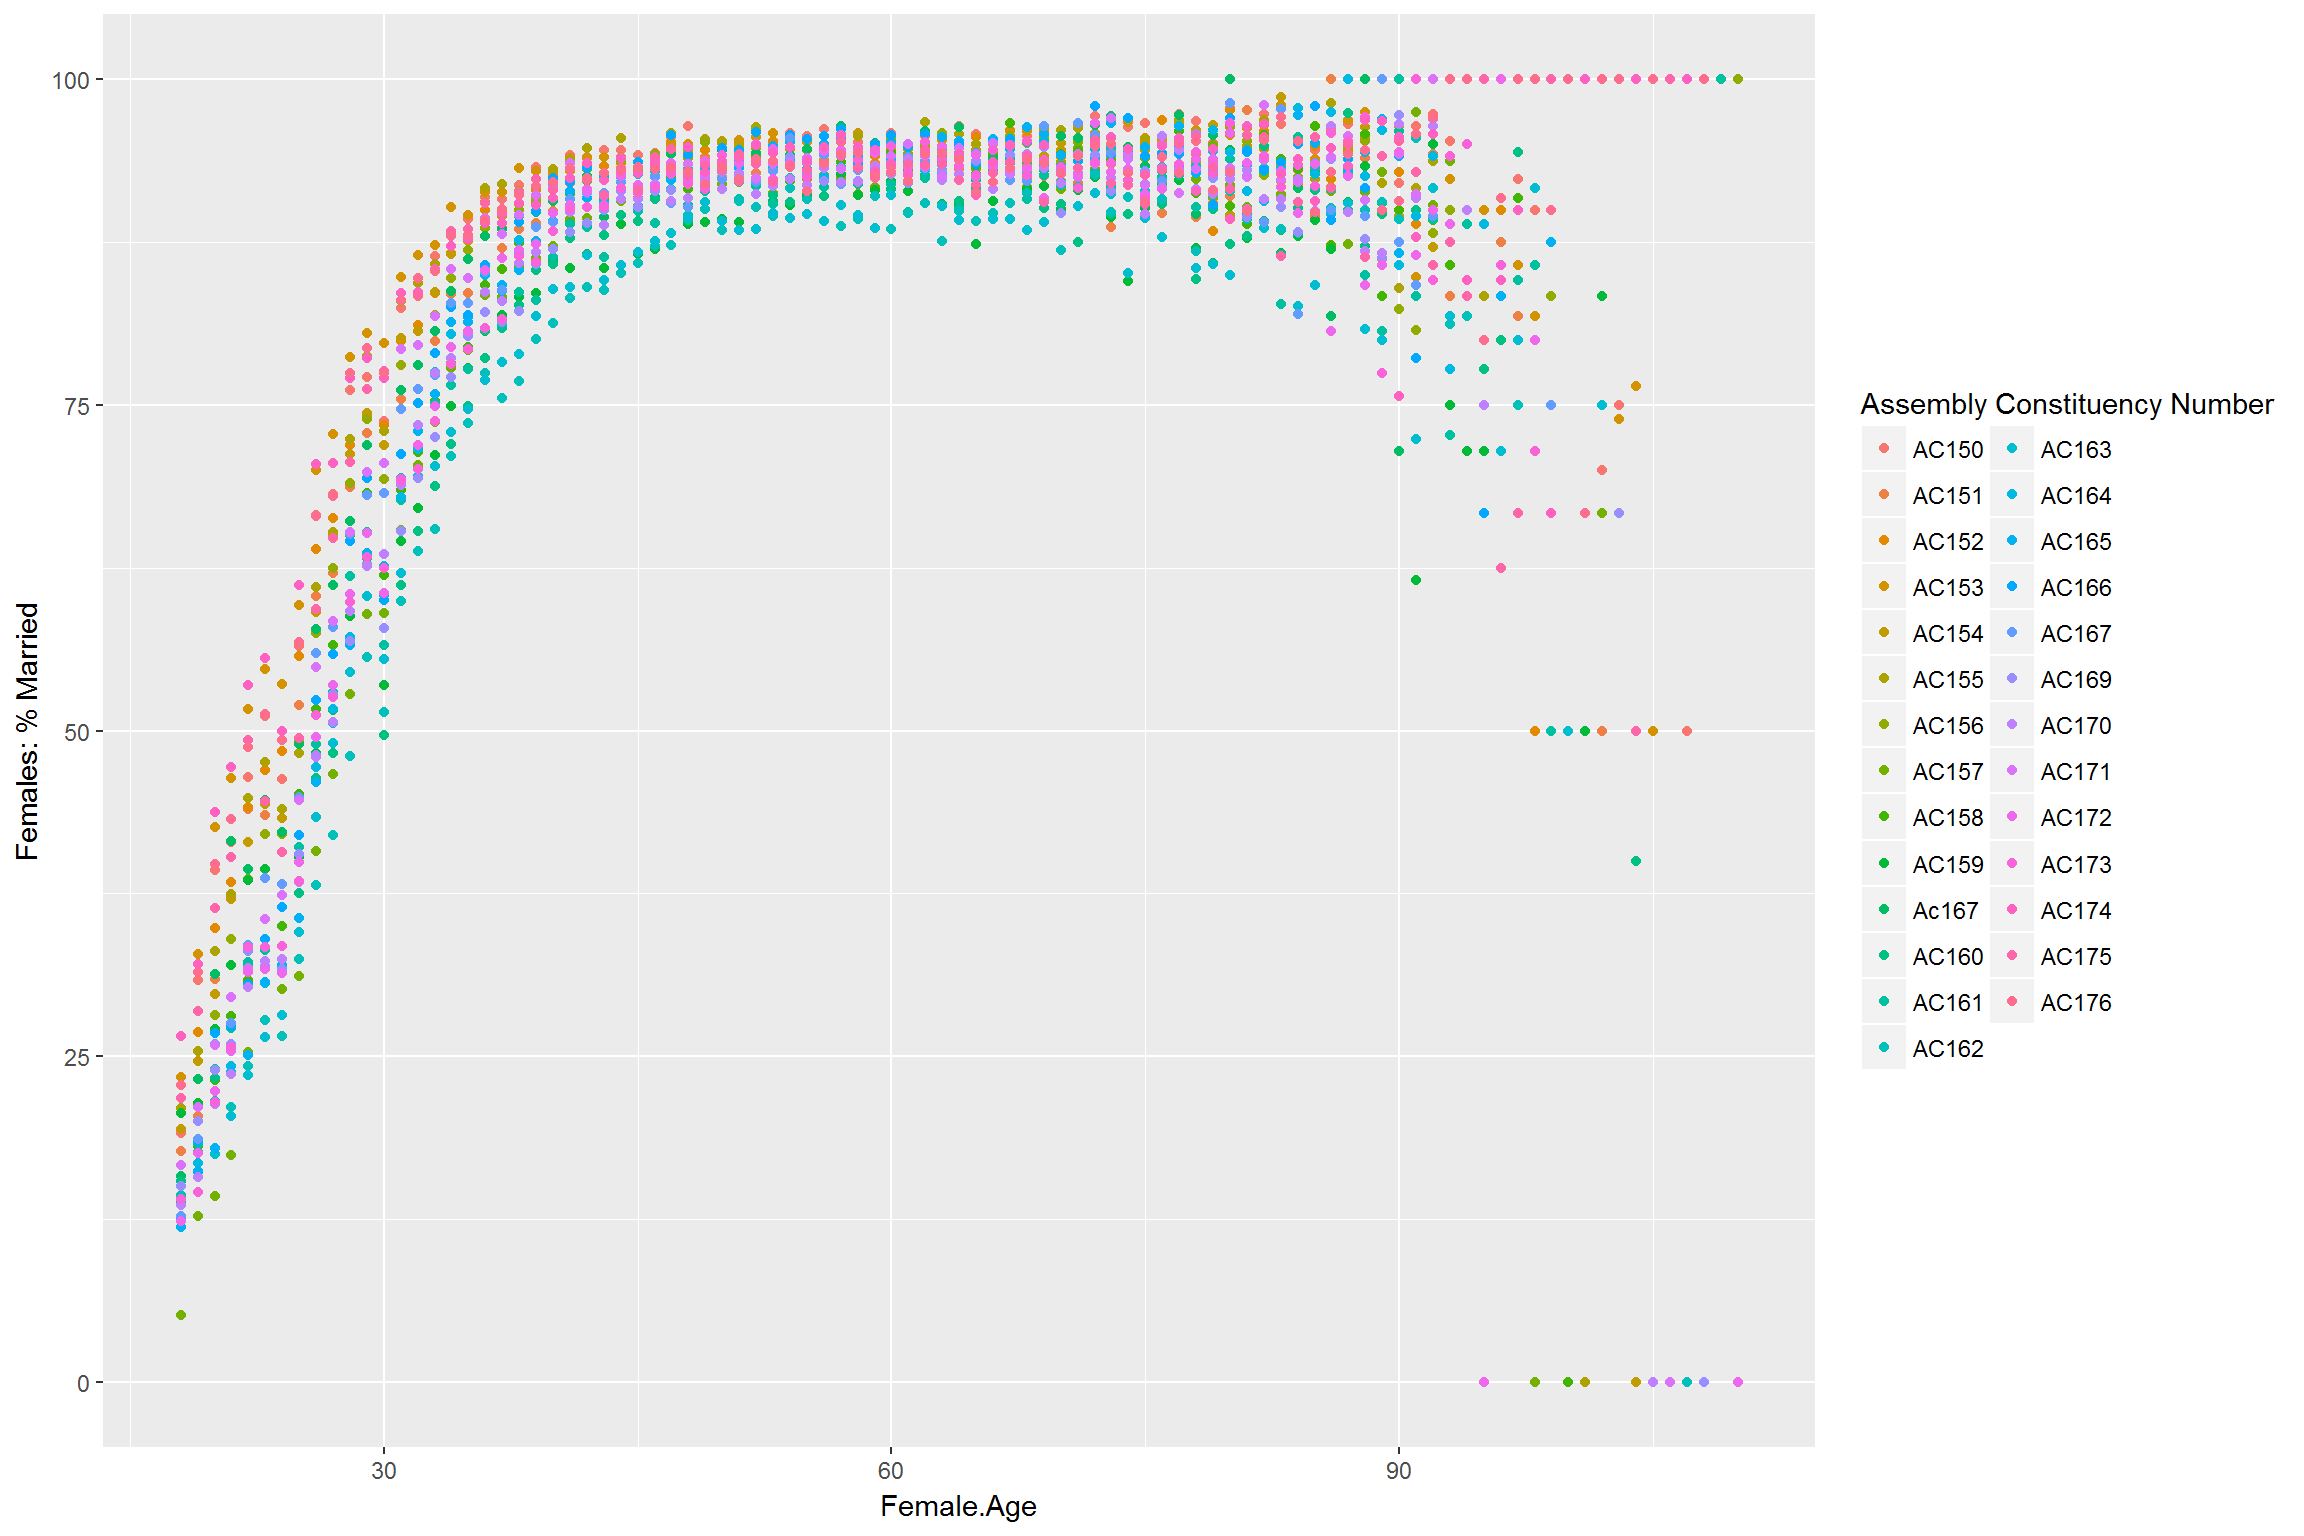
We see that depending on the AC, from 12-25% of the females get married at the age of 18 (It is surprising to see that not even a single AC is at 0% at 18) and grows exponentially until we reach a peak at around 37. Around 90 we start seeing a relation other than husband again being used.
Checking for the Male:Female ratio 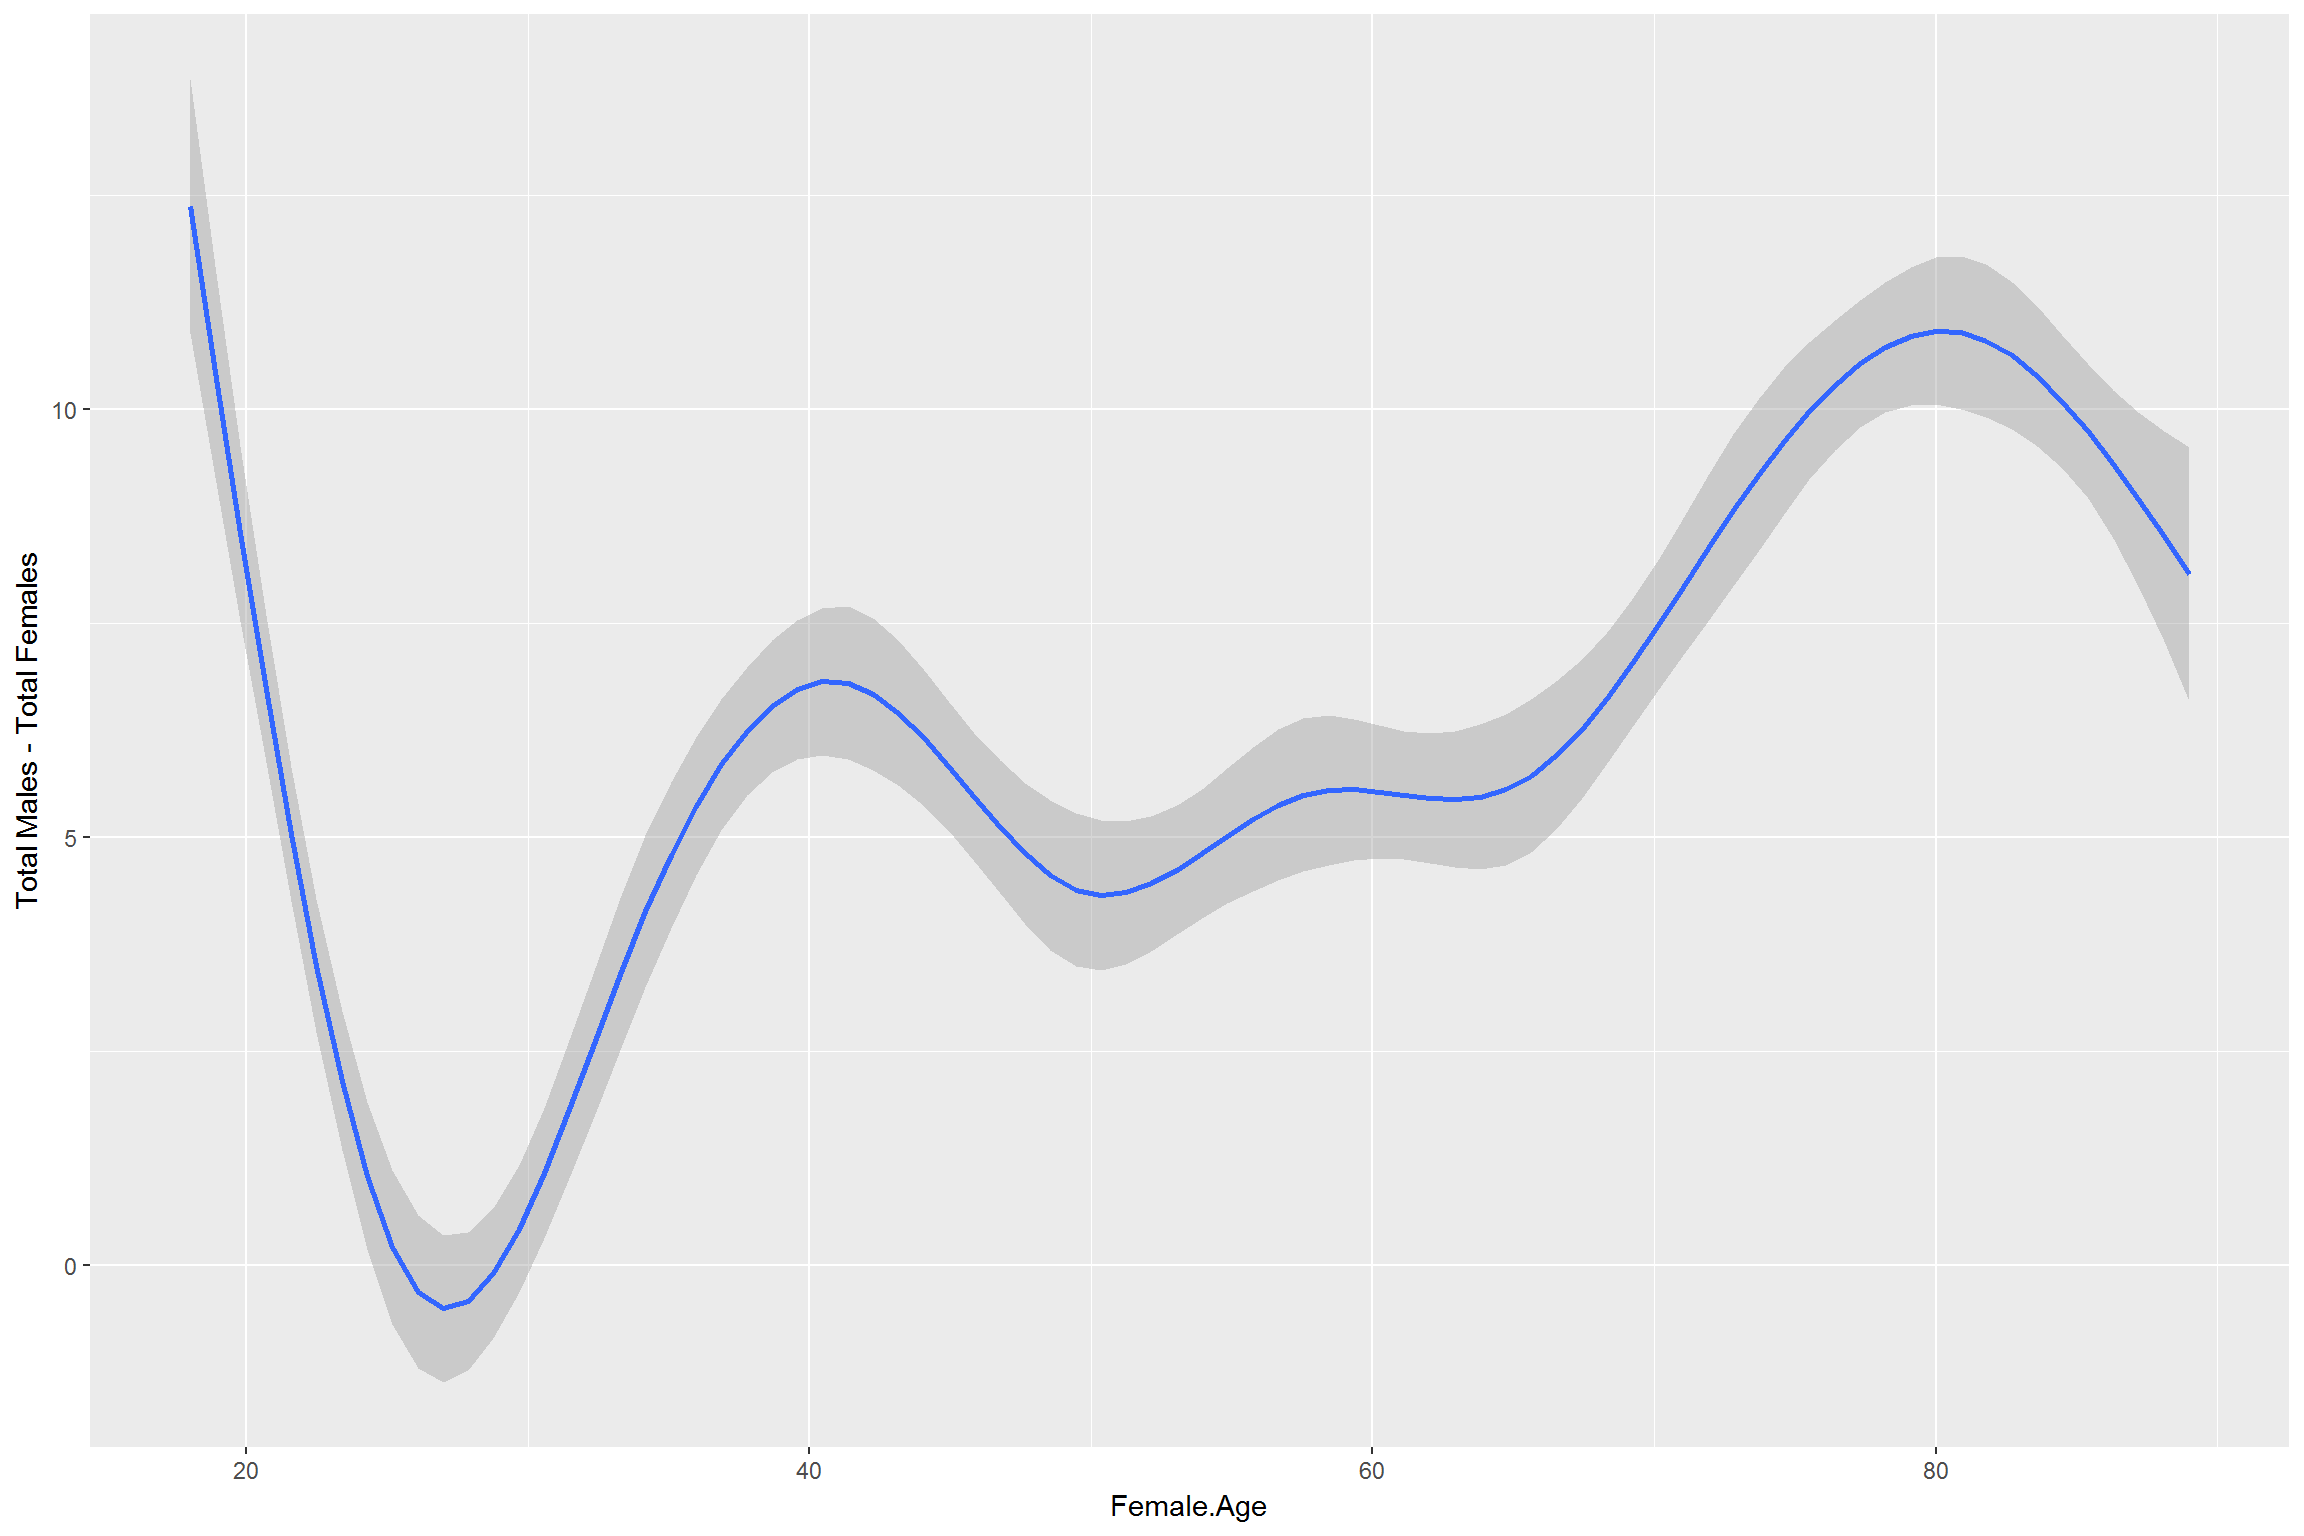 We see that at the age of 18 we have 10% More males compared to Females. This ratio falls down to nearly 0% by the age of 30 after which it stabilizes to 5% more males till the age of 60-70 from the age of 90+ Male % starts falling and reaches 0% by the age of 100. Post 100 The % goes in negative, but this may be due to wrong record keeping by the EC and can be a stastical anolmoly due to the low voter count in this age range.
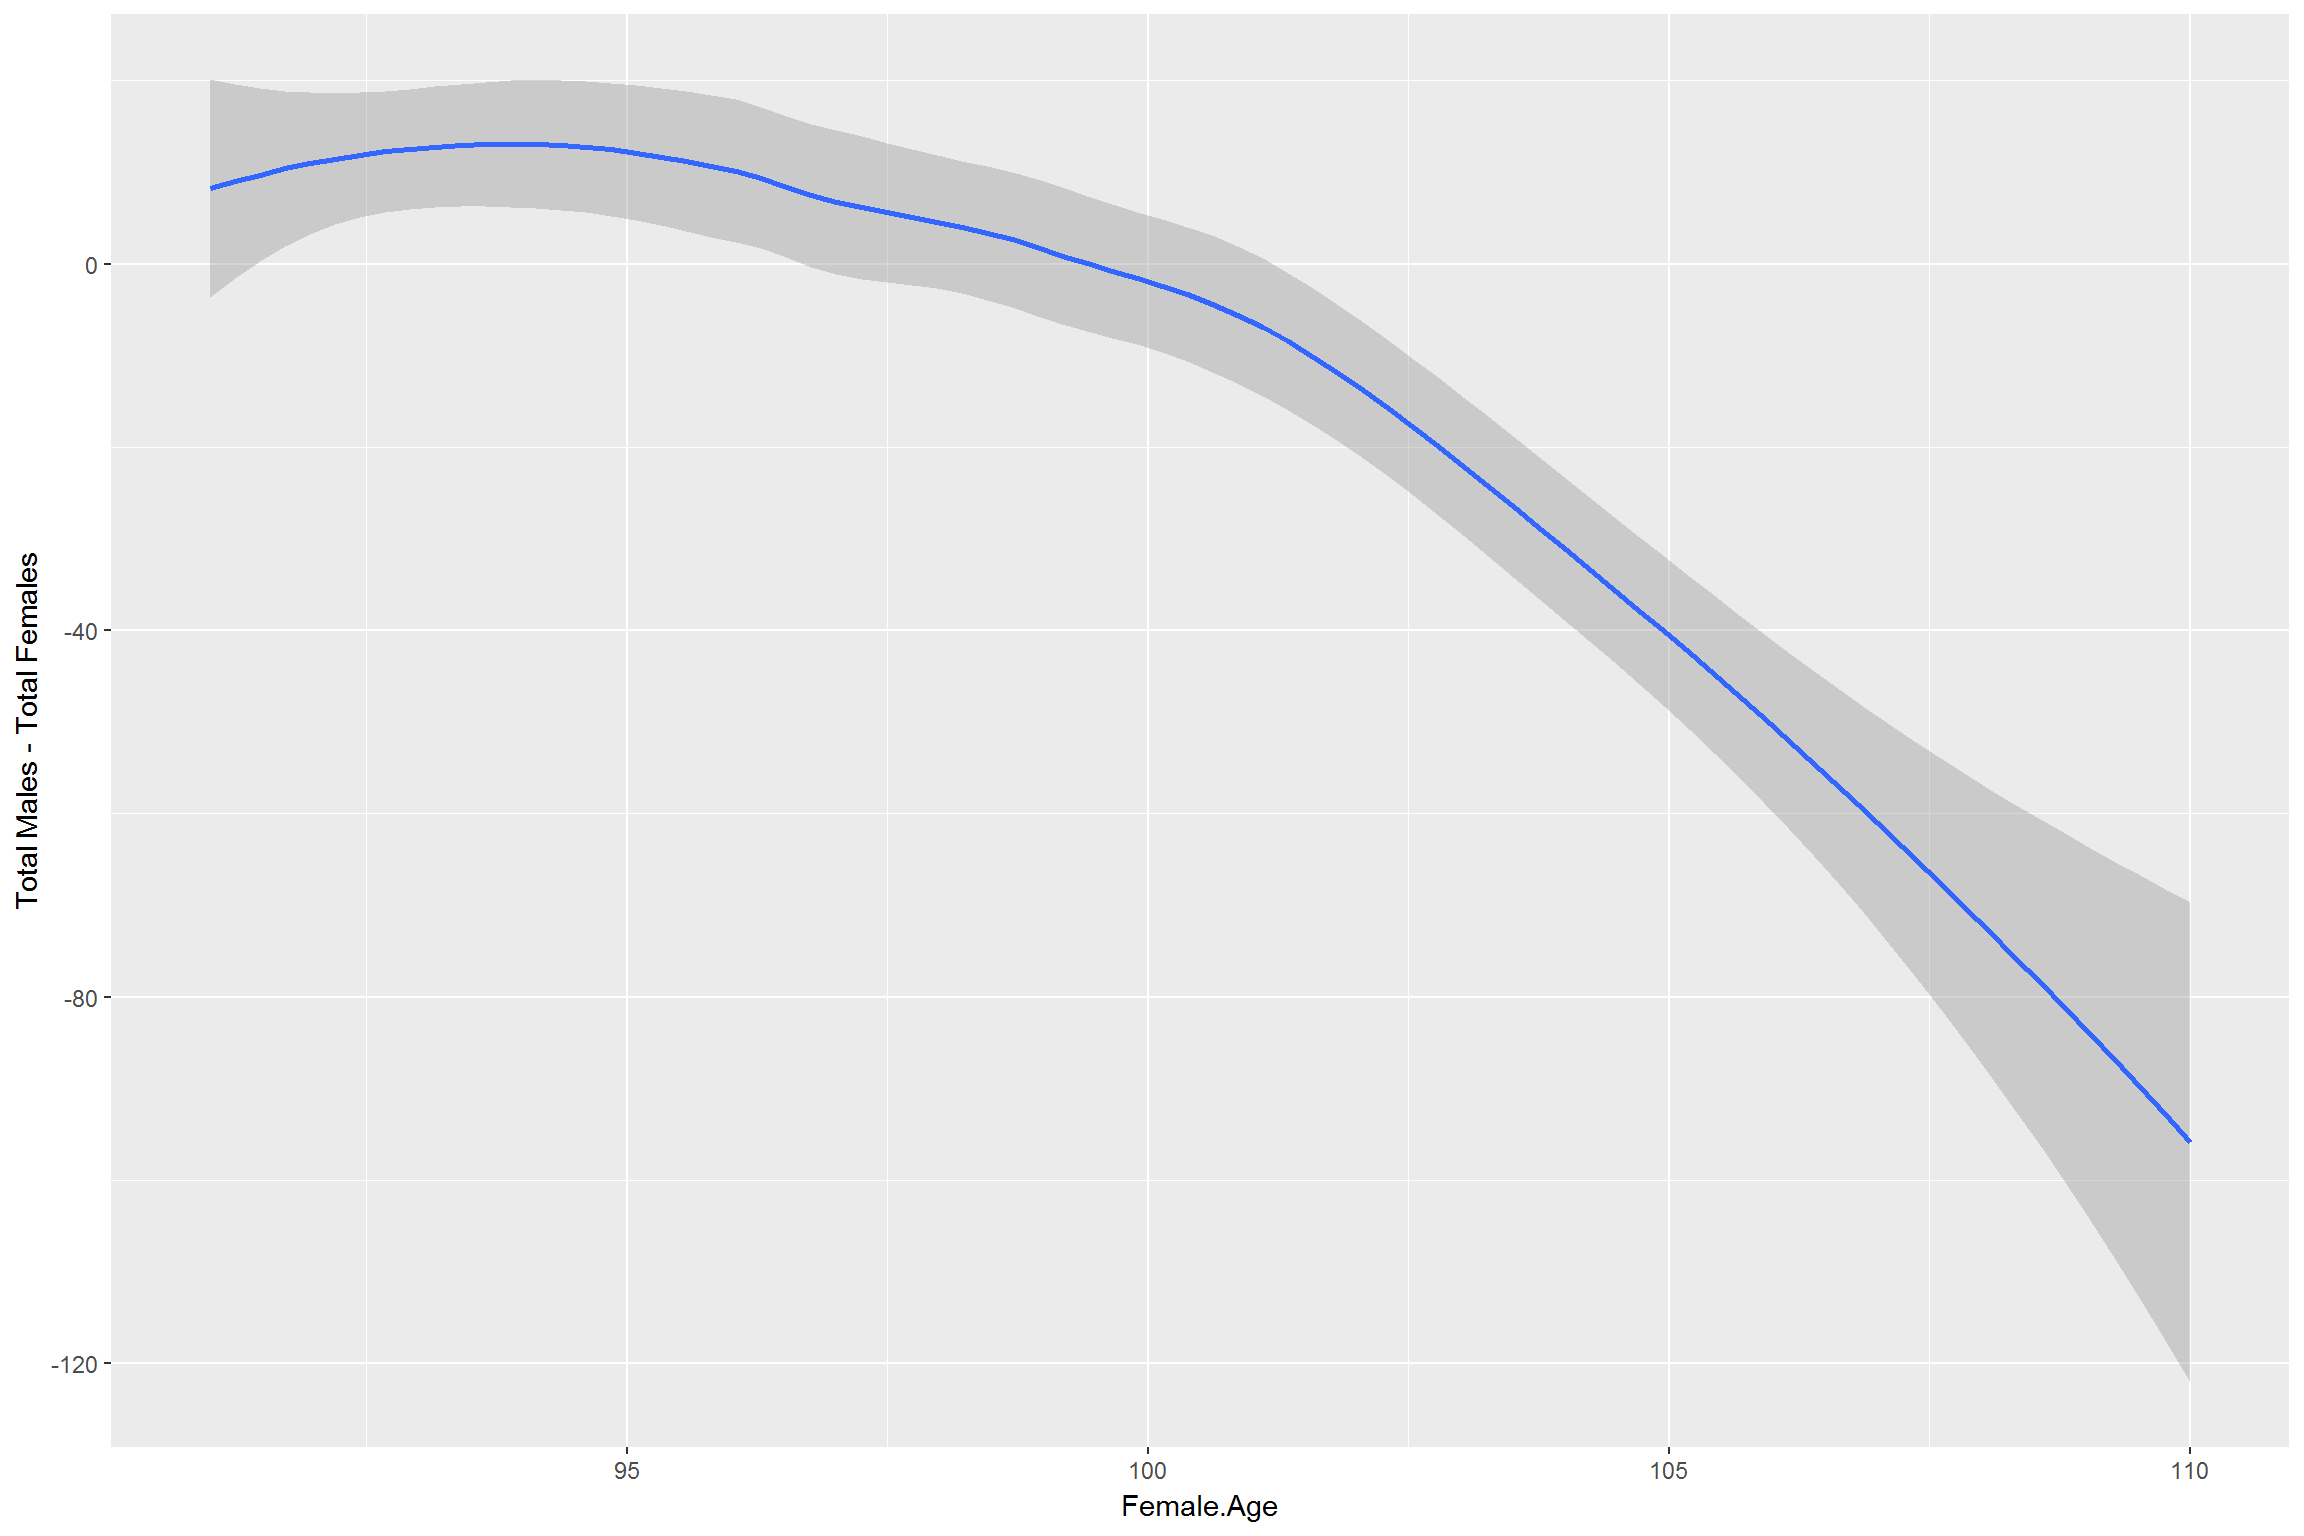
Where should govt. invest in child care and schools?
The typical child bearing age of a female is upto 32,We will assume that girls have their first child by 27 and second by 30-32 years.
So subtracting 27 from the age of all women above 27 will give us approximate age of the first child and subtracting 31 will give the approximate age of the second child. We will be using this data to identify AC’s which require pre-schools, Schools, and PU Colleges. We will project the requirement for the next 3 years. i.e.
- Kids from 0-3 will count towards preschool
- Kids from 3-6 will count towards school.
- Kids from 13 to 16 will count towards PU College
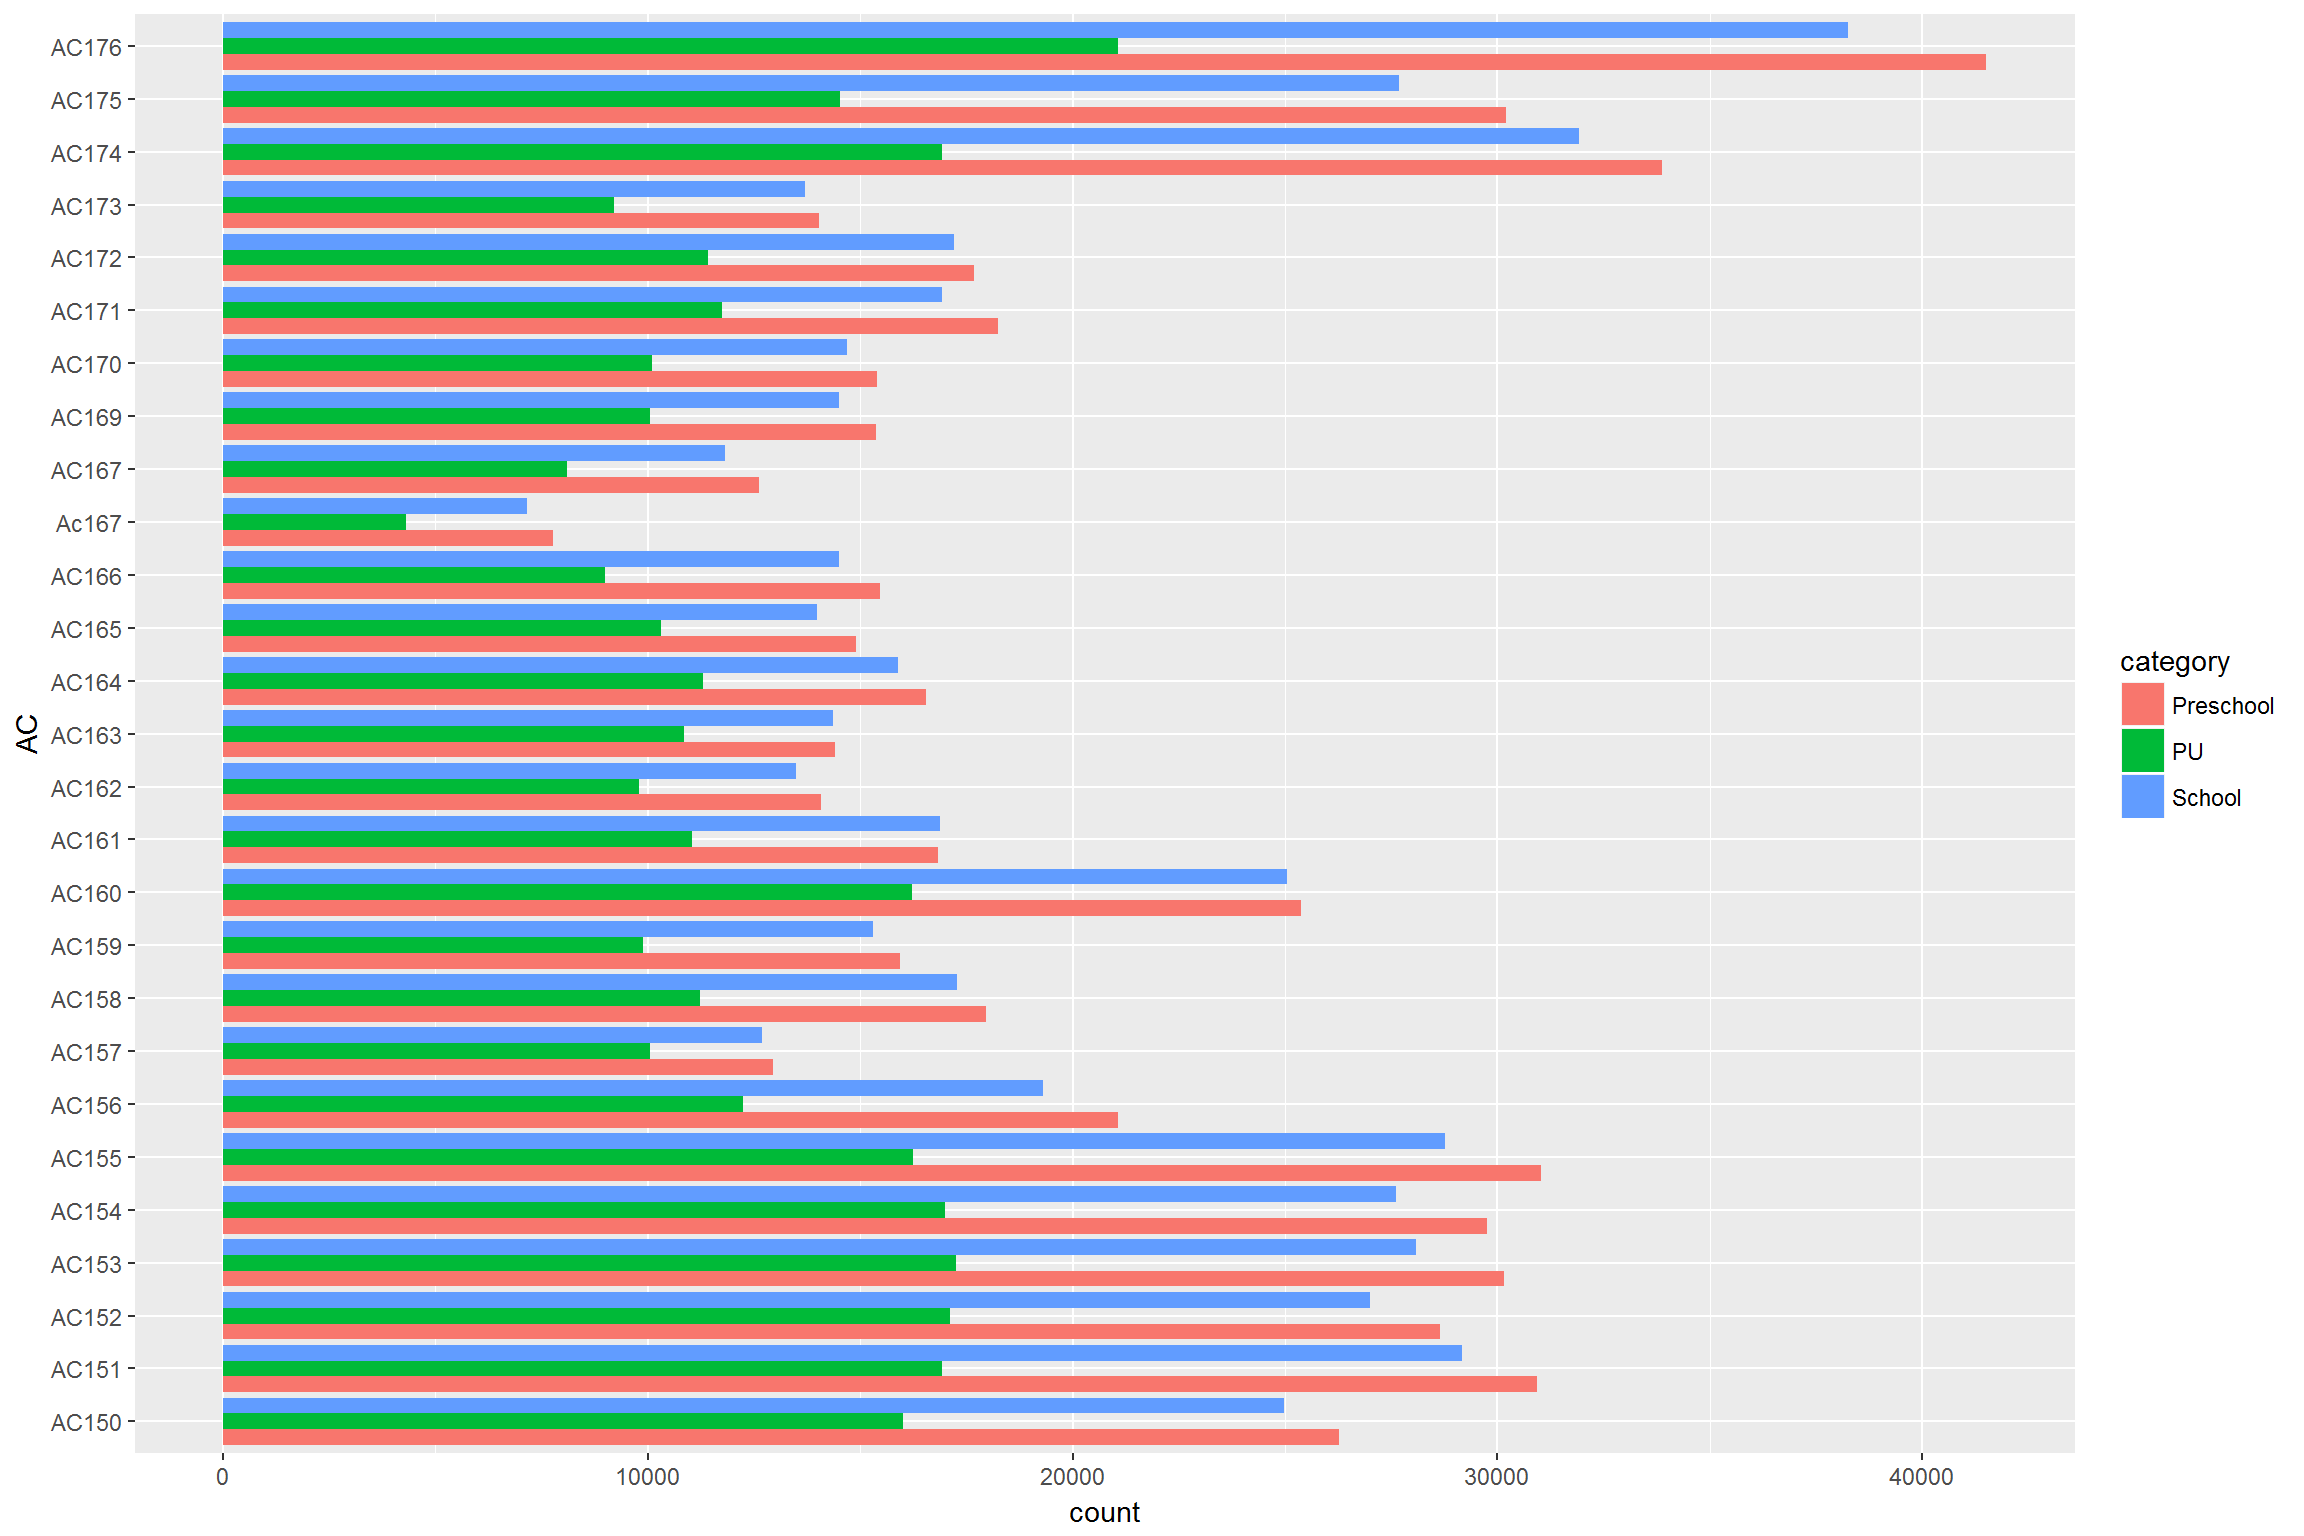
The top-5 AC’s which need to invest in pre-schools are.
##     X    AC  category count Standard.Deviation
## 76 76 AC175 Preschool 30210             0.8295
## 4   4 AC151 Preschool 30929             0.8326
## 16 16 AC155 Preschool 31036             0.8404
## 73 73 AC174 Preschool 33867             0.8311
## 79 79 AC176 Preschool 41515             0.8365
The top-5 AC’s which need to invest in PU-Colleges are.
##     X    AC category count Standard.Deviation
## 75 75 AC174       PU 16923             0.7950
## 15 15 AC154       PU 16997             0.7961
## 9   9 AC152       PU 17124             0.7985
## 12 12 AC153       PU 17252             0.8063
## 81 81 AC176       PU 21066             0.7985