
BBMP has 198 wards, out of which elections were held for 197 wards. The data filed for 38 candidates is incomplete (missing contact details/family details etc.). As additional data is available this report will be update. you can always find the latest copy of this report at http://rpubs.com/vijayvithal/106792 This report looks at the profile of the candidates filed by the three mainstream parties and analyses the election on various factors.
Candidate quality
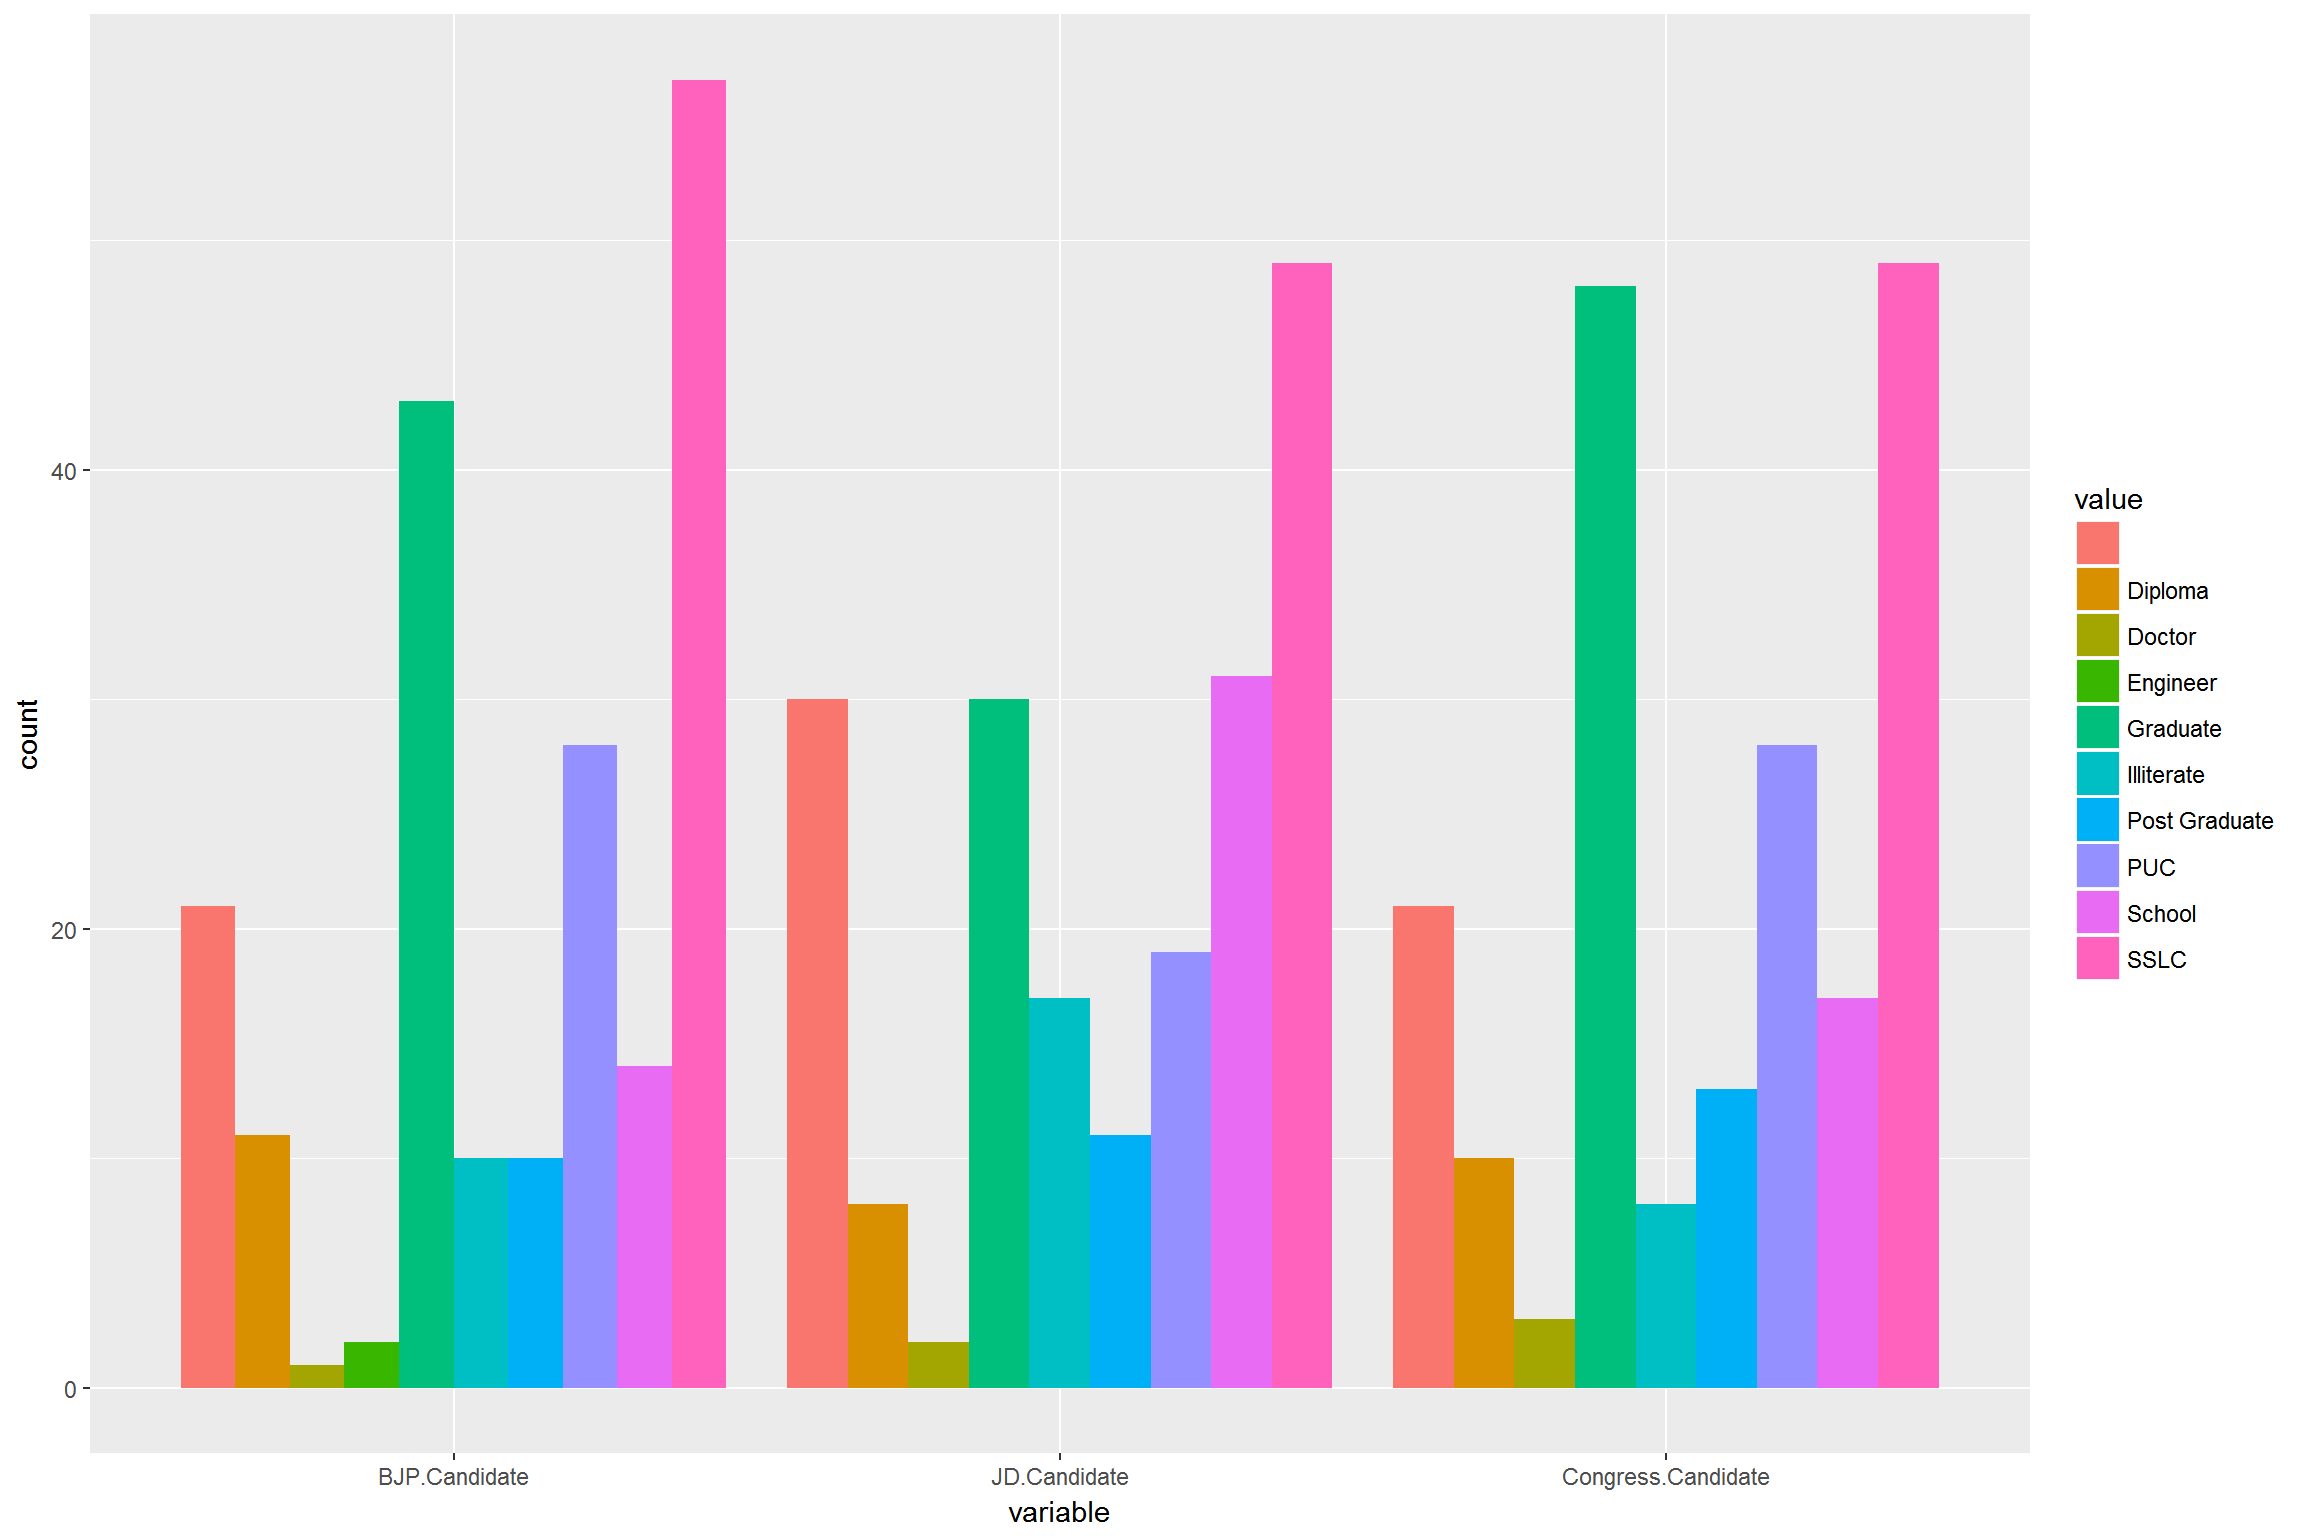
The education level of candidates is as follows
The following details are missing from the data set.
- Criminal records
- Wealth
- History of social activities
- Connect with the constituency
About BBMP
In 2010 the Existing BMP was mearged with surrounding CMC’s, TMC’s, ZP’s and gram panchayat’s to form BBMP. This exercise resulted in consolidation of various units of local governance with over a thousand elected representatives into a single unit with 198 elected representatives.
The wards delimitation’s was done based on the 2001 census which showed dense clusters in the core BMP area and sparse population in the outer wards.
The distribution of wards among the old BMP Area (Inner wards) and new BBMP areas(Outer wards) is
##
## Inner Outer
##   136    62
The average ward area in sq.km in inner and outer wards is
## Inner Outer
## 1.612 7.940
In the very next year it was evident that the wards are imbalanced, when the 2011 census showed that the outer wards had much higher population compared to the inner wards.
In 2011 the average population of inner and outer wards was
## Inner Outer
## 37729 53429
## Bangalore Population Data.
## 2001 Census: 45.92 Lakh
## 2011 Census: 84.74 Lakh
## 2015 : 110.0 Lakh (Estimate)The average growth in population in the last decade (2001 to 2011) has been
## Inner Outer
##  5901 29001
It is estimated that the additional 25.26 Lakh citizens are predominantly added to the outer wards.
Voter Behavior
Checking for voting percentage the voter turnout this time increased by 4.7514. Dividing this data into core (Inner Wards) and non-core(Outer Wards) wards we find that the turnout increase is more in the inner wards.
## Inner Outer
## 5.091 3.995
However 36 wards showed lower turnout this year, these wards are further subdivided as follows
## Inner Outer
##    21    15
The election results in 2010 were as follows
##         BJP    CONGRESS INDEPENDENT       JD(S)      Others        SDPI
##         111          65           6          15           1          NA
This result has changed to
##         BJP    CONGRESS INDEPENDENT       JD(S)      Others        SDPI
##         101          75           6          14           1           1
While the absolute numbers indicate that there was very little anti-incumbency factor, evaluating ward wise data ward indicates a strong anti incumbency current. with the citizens changing the corporator irrespective of his/her party, It is not clear whether the citizens are satisfied with an alternate instead of an alternative.
A total of 86 constituency changed their party.
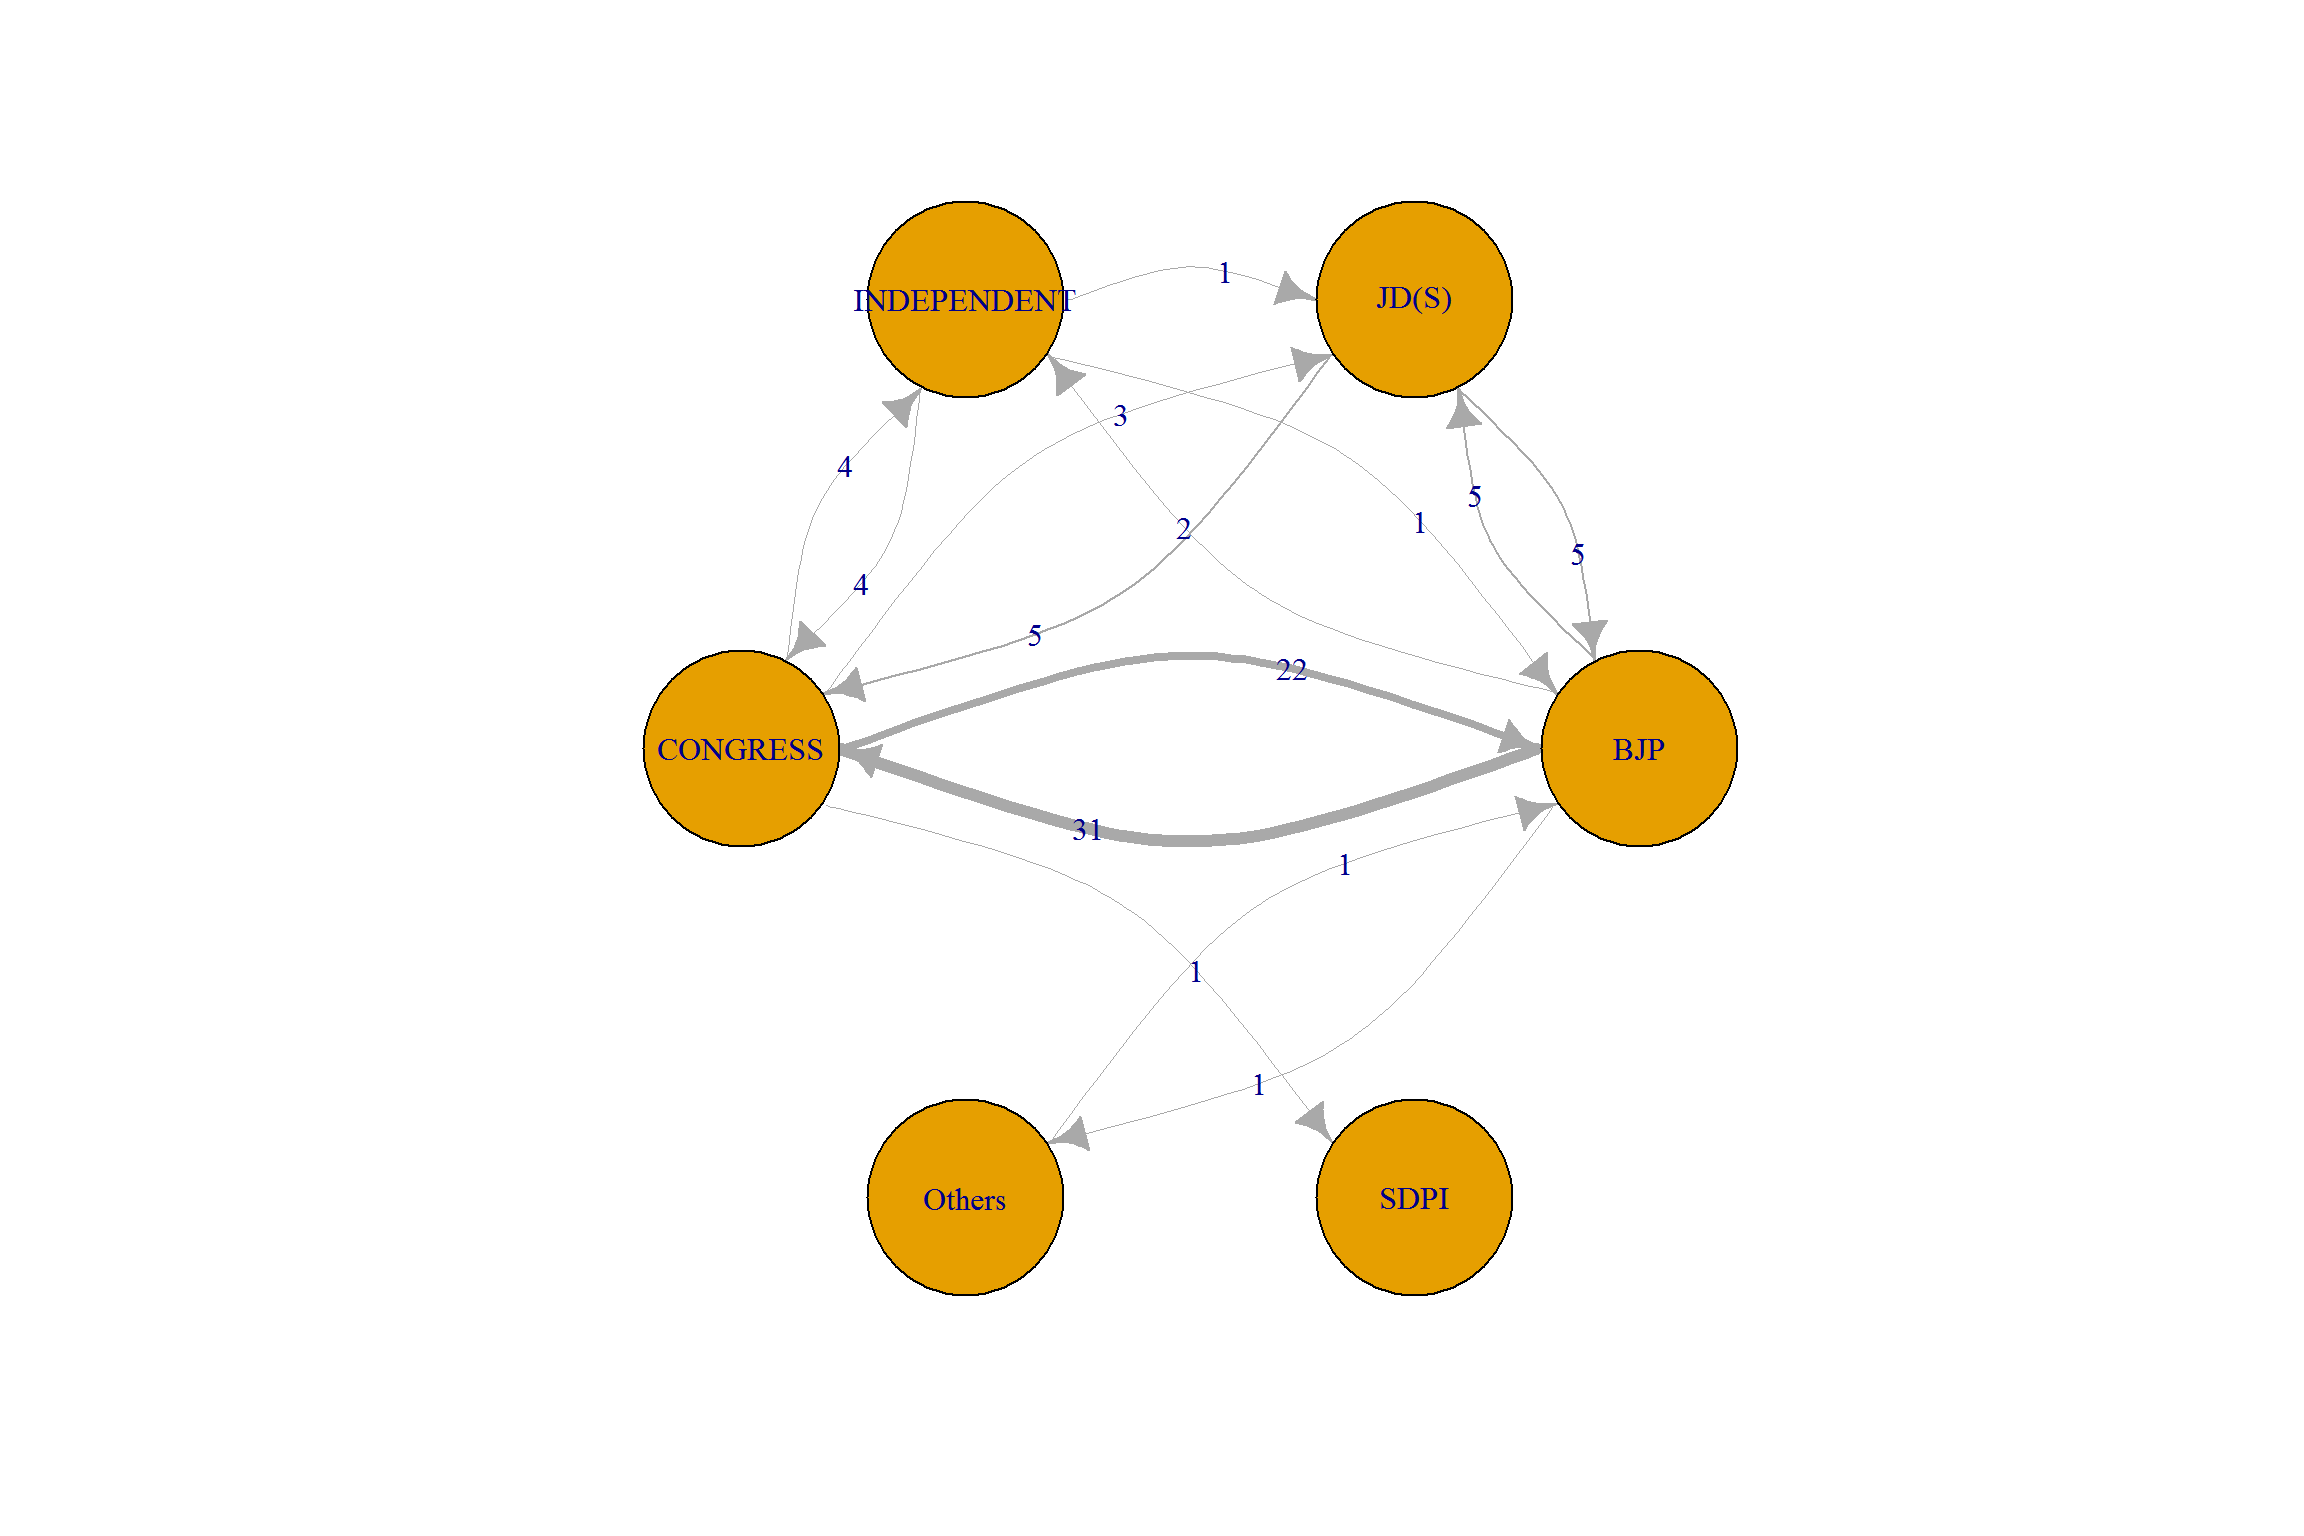 The distribution of this beneficiary of this change was as follows
##         BJP    CONGRESS INDEPENDENT       JD(S)      Others        SDPI
##          29          40           6           9           1           1
The distribution of seats among the inner and outer wards is
##
##               Inner Outer
##   BJP            64    37
##   CONGRESS       52    23
##   INDEPENDENT     5     1
##   JD(S)          13     1
##   Others          1     0
##   SDPI            1     0
Causes for Voter apathy?
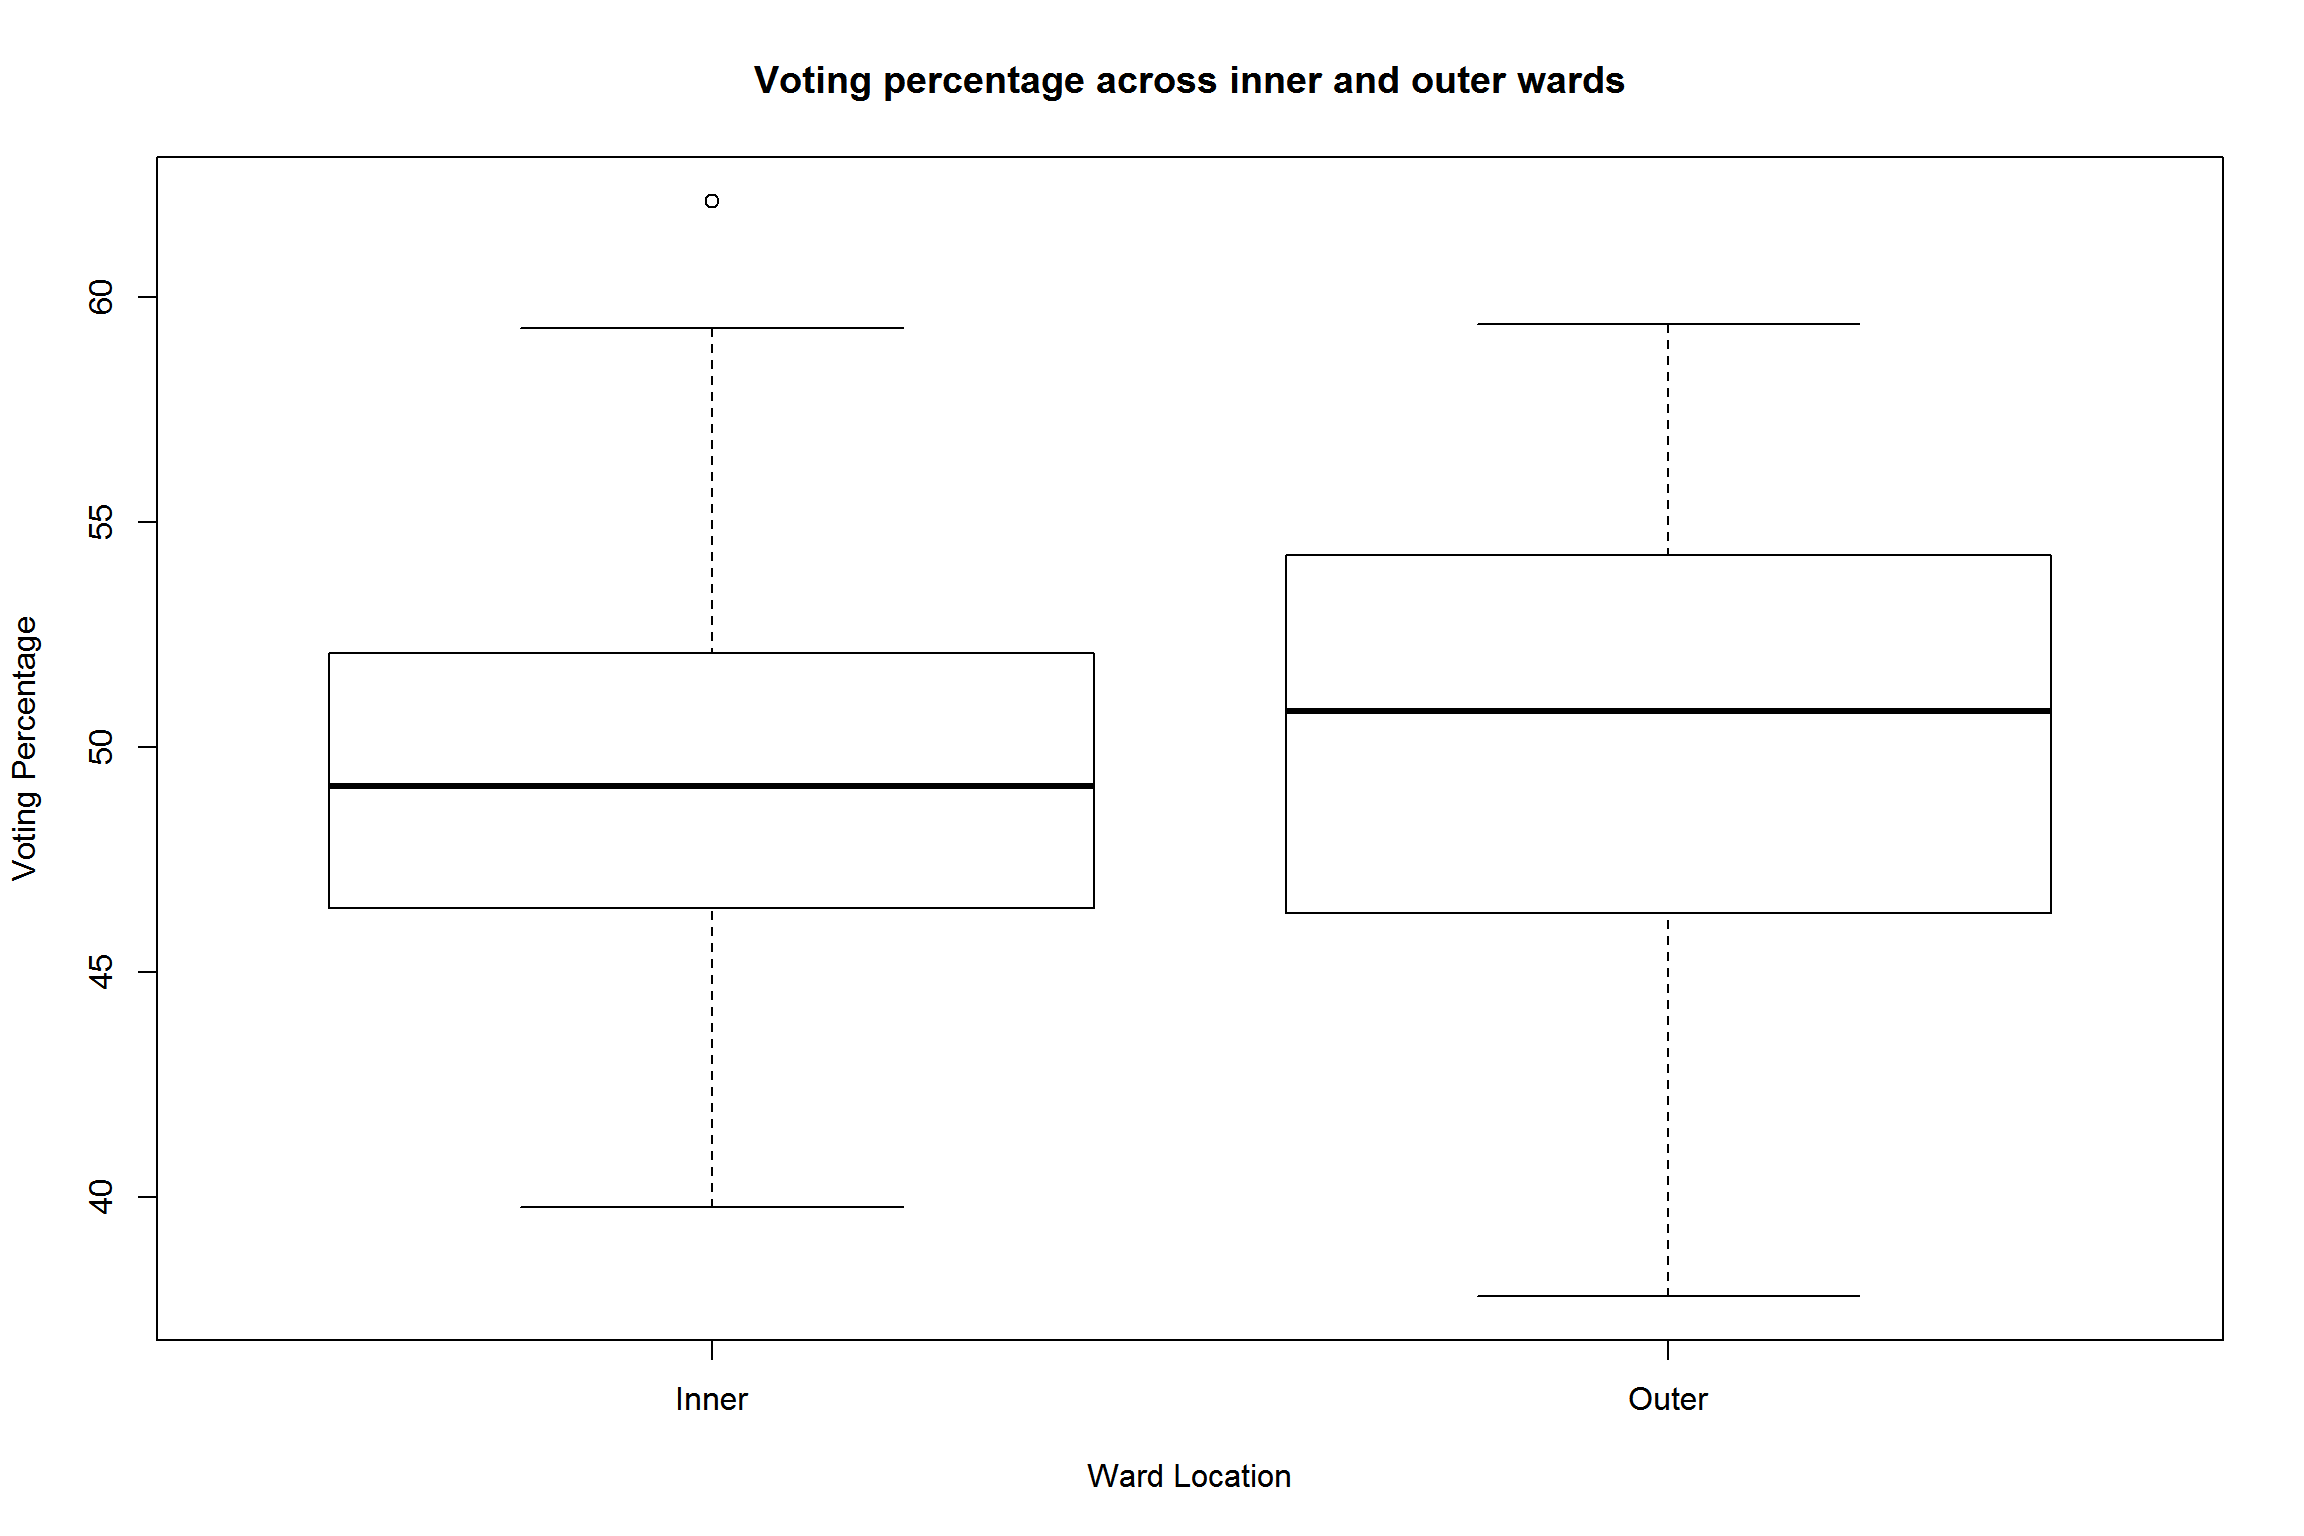
A voter percentage of less than 50% resulted in various sections of the society being blamed for its apathy. While an excellent analysis of the issues in voter turnout is presented in Who is responsible for a low voter turnout Running a stastical analysis shows us that,
- The voters in outer wards showed much greater participation compared to voters in Inner ward.
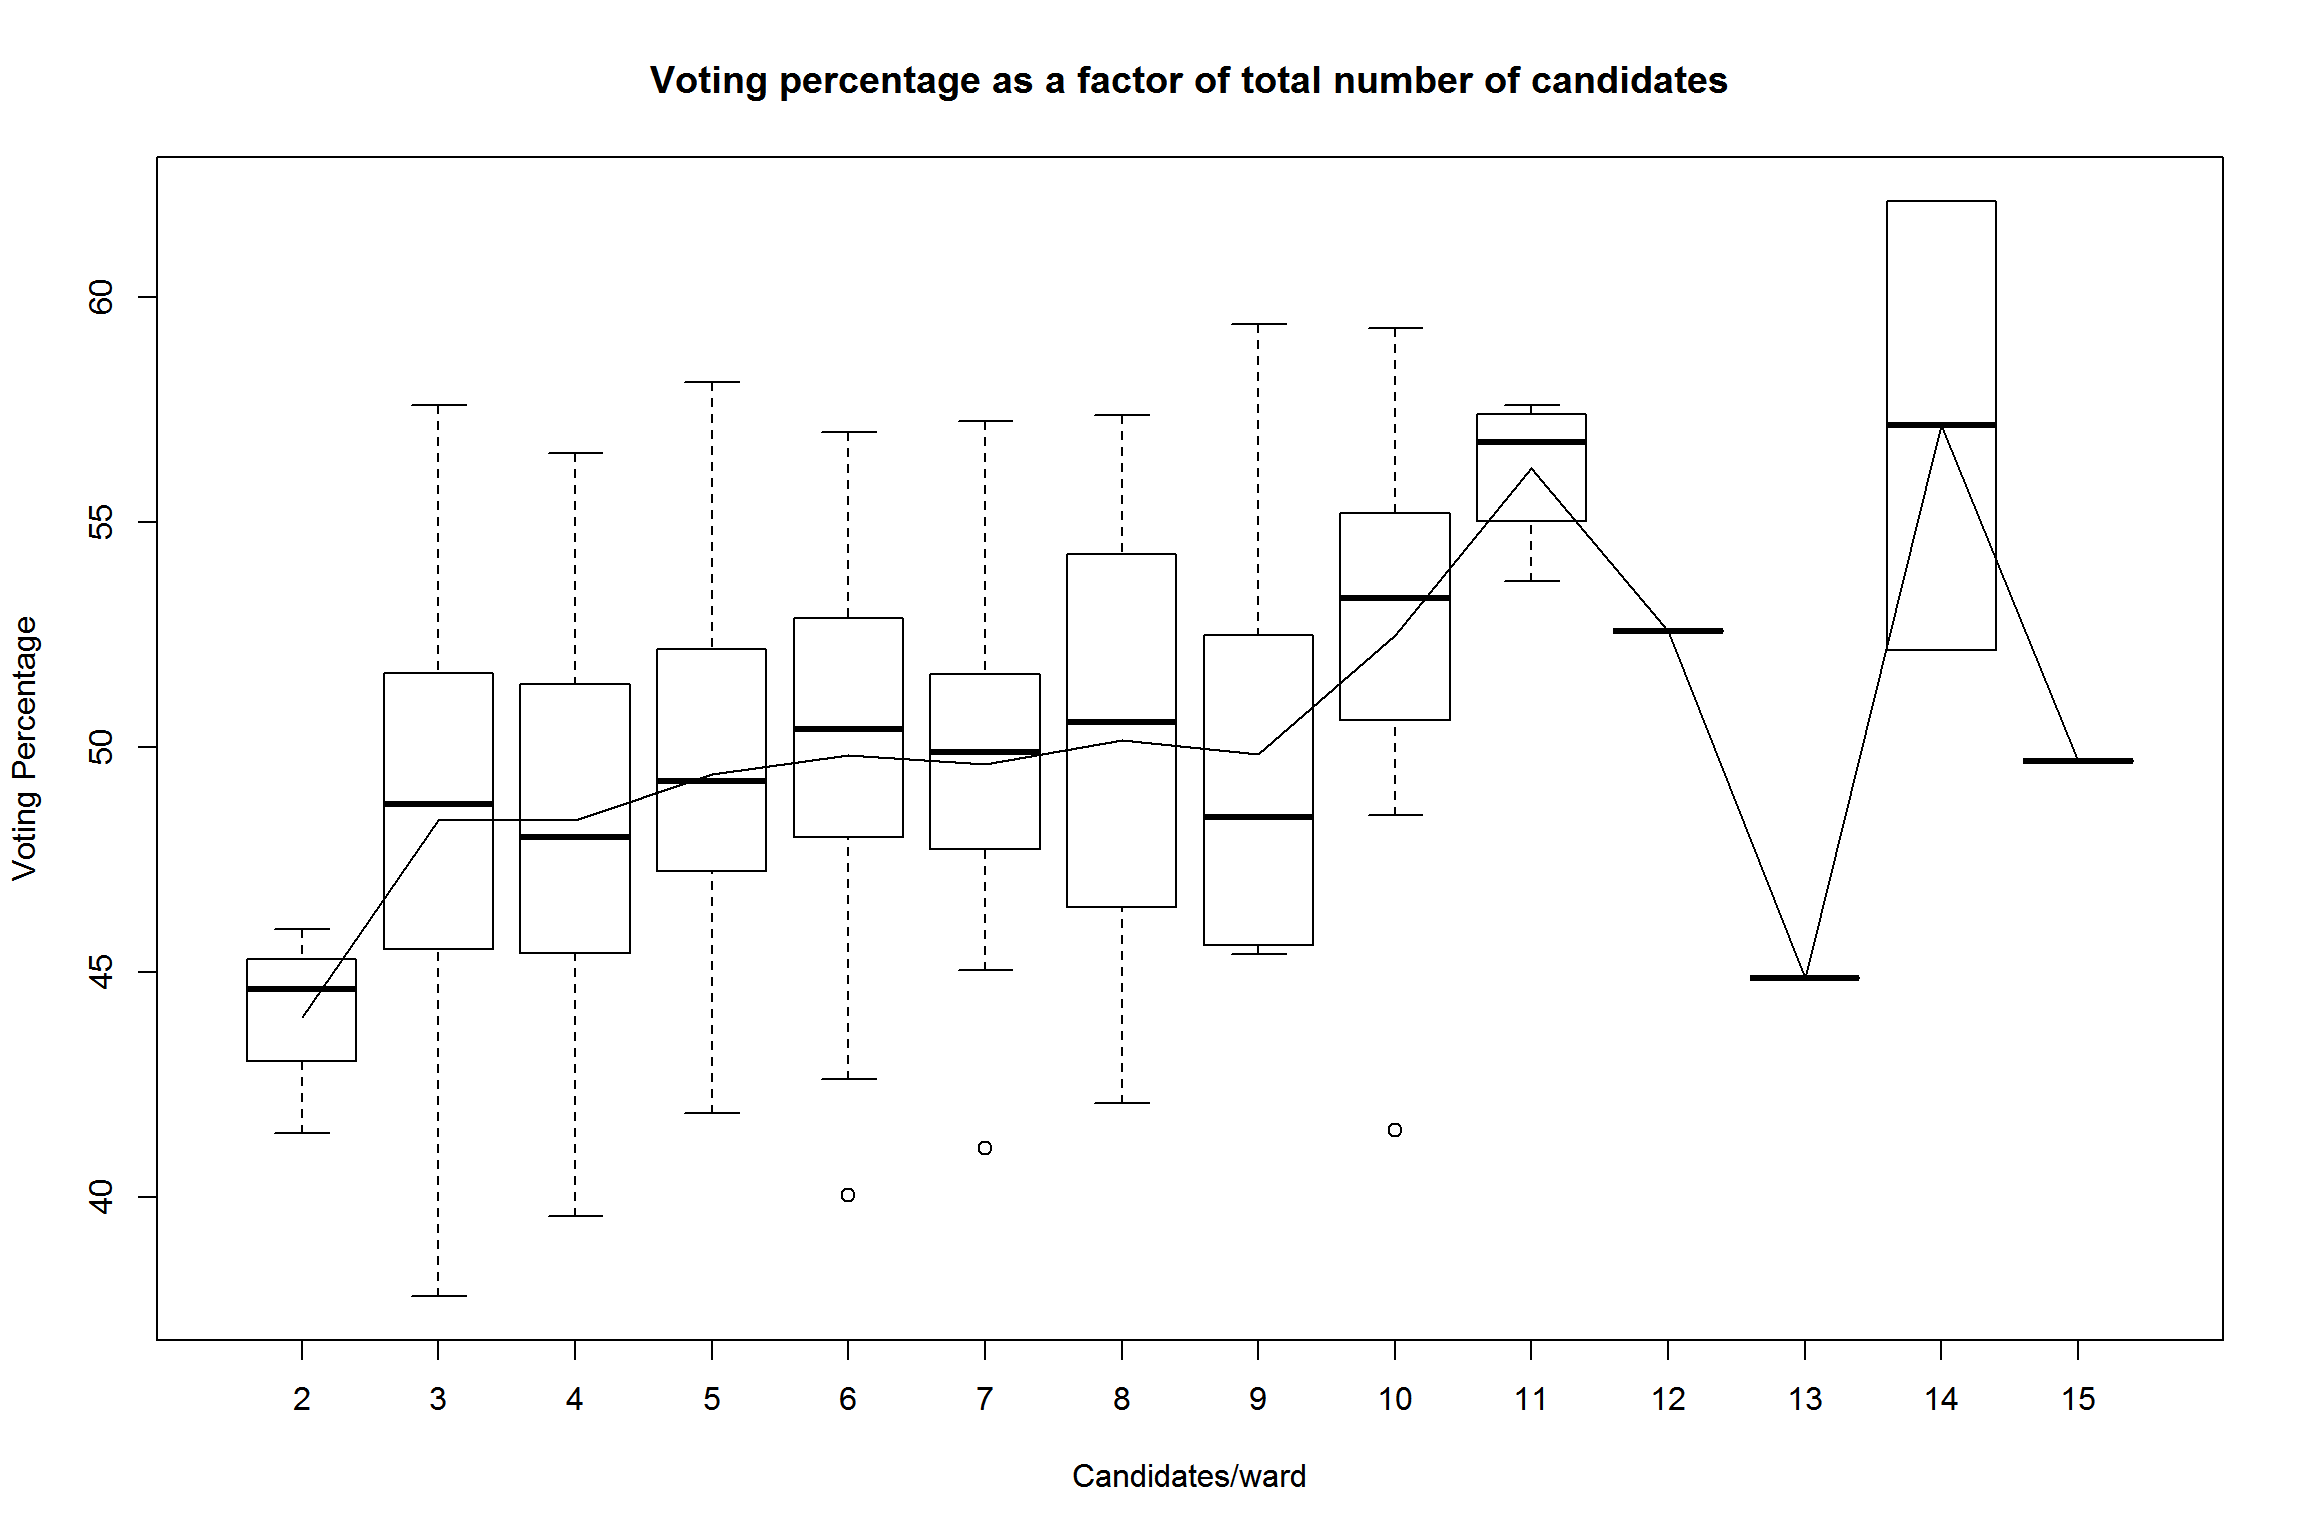
- Voting percentage was higher when the choice of candidates was more.
- The impact of gender reservation is a sub case of diversity of choice, betweeen seats reserved for women vs gender neutral seats for the same caste reservation. the difference in voter turnout is negligible.
Typically in areas with high migrant population, The actual voting percentage is different than the reported voting percentage. This is due to two factors.
- A significant percentage of people in the voters list have migrated out of the area, and their names are still in the voters list.
- A significant number of new migrants are still not in the voters list due to voter ignorance or lethargic babudom.

The scenario in the next election.
It is expected that subject to the restructuring report getting Center’s nod, we may go for a re-election in less than an year. This election will have the following changes from the current election
- Breaking up BBMP in 5 municipal corporations.
- Ward delimitation based on the 2011 census,(Or the latest voter list?)
- Provision for further population growth in outer wards during ward delimitation.
The current approximate mean outer wards population (assuming growth rate in these wards is 18%) is 122 thousand in 2015.
If the current wards are delimited in proportion to the population, then the ratio of outer to inner wards will be 2.2459 : 1. i.e. for existing 198 wards we will have 61 inner wards and 137 outer wards.
The restructuring report speaks of factoring in the future increase in ward population during delimitation, this will result in distrubution of the proposed 400 wards across 102 inner wards and 298 outer wards.
Conclusion and future work.
While there was a strong anti-incumbancy current, and as per some reports the winning margin for BJP was 1% or less indicating a closely fought elections, It is not clear what led to the vote swing in some seats and not in other.
- Projects was not an issue. Retaining wards and flipping wards had the same project spread.
- Project amount was not an issue. We saw the same statistics for both the retaining and flipping wards.
- Number of candidates was not an issue.
- In a few sample ward studies, the ward infrastructure quality was not an issue.
Possible explaination which cannot be proven with the available data-set is:
- Voting took place on caste and religious lines, i.e. change in demographic pattern
- Voting took place on non-local issues(BBMP elections and Indo-Pak relations?)
Does voting for the overall winner matter
A certain politician making veiled threats of “smooth” center-state relations and his opponent making similar threats of state-municipal relations raises the question of whether voting for a given party influences the ward development.
Analysing the budget tells us that the influence of party on project amount is minimal. Contrary to expectations independents and JD-s recieved more than the first two positioned parties. 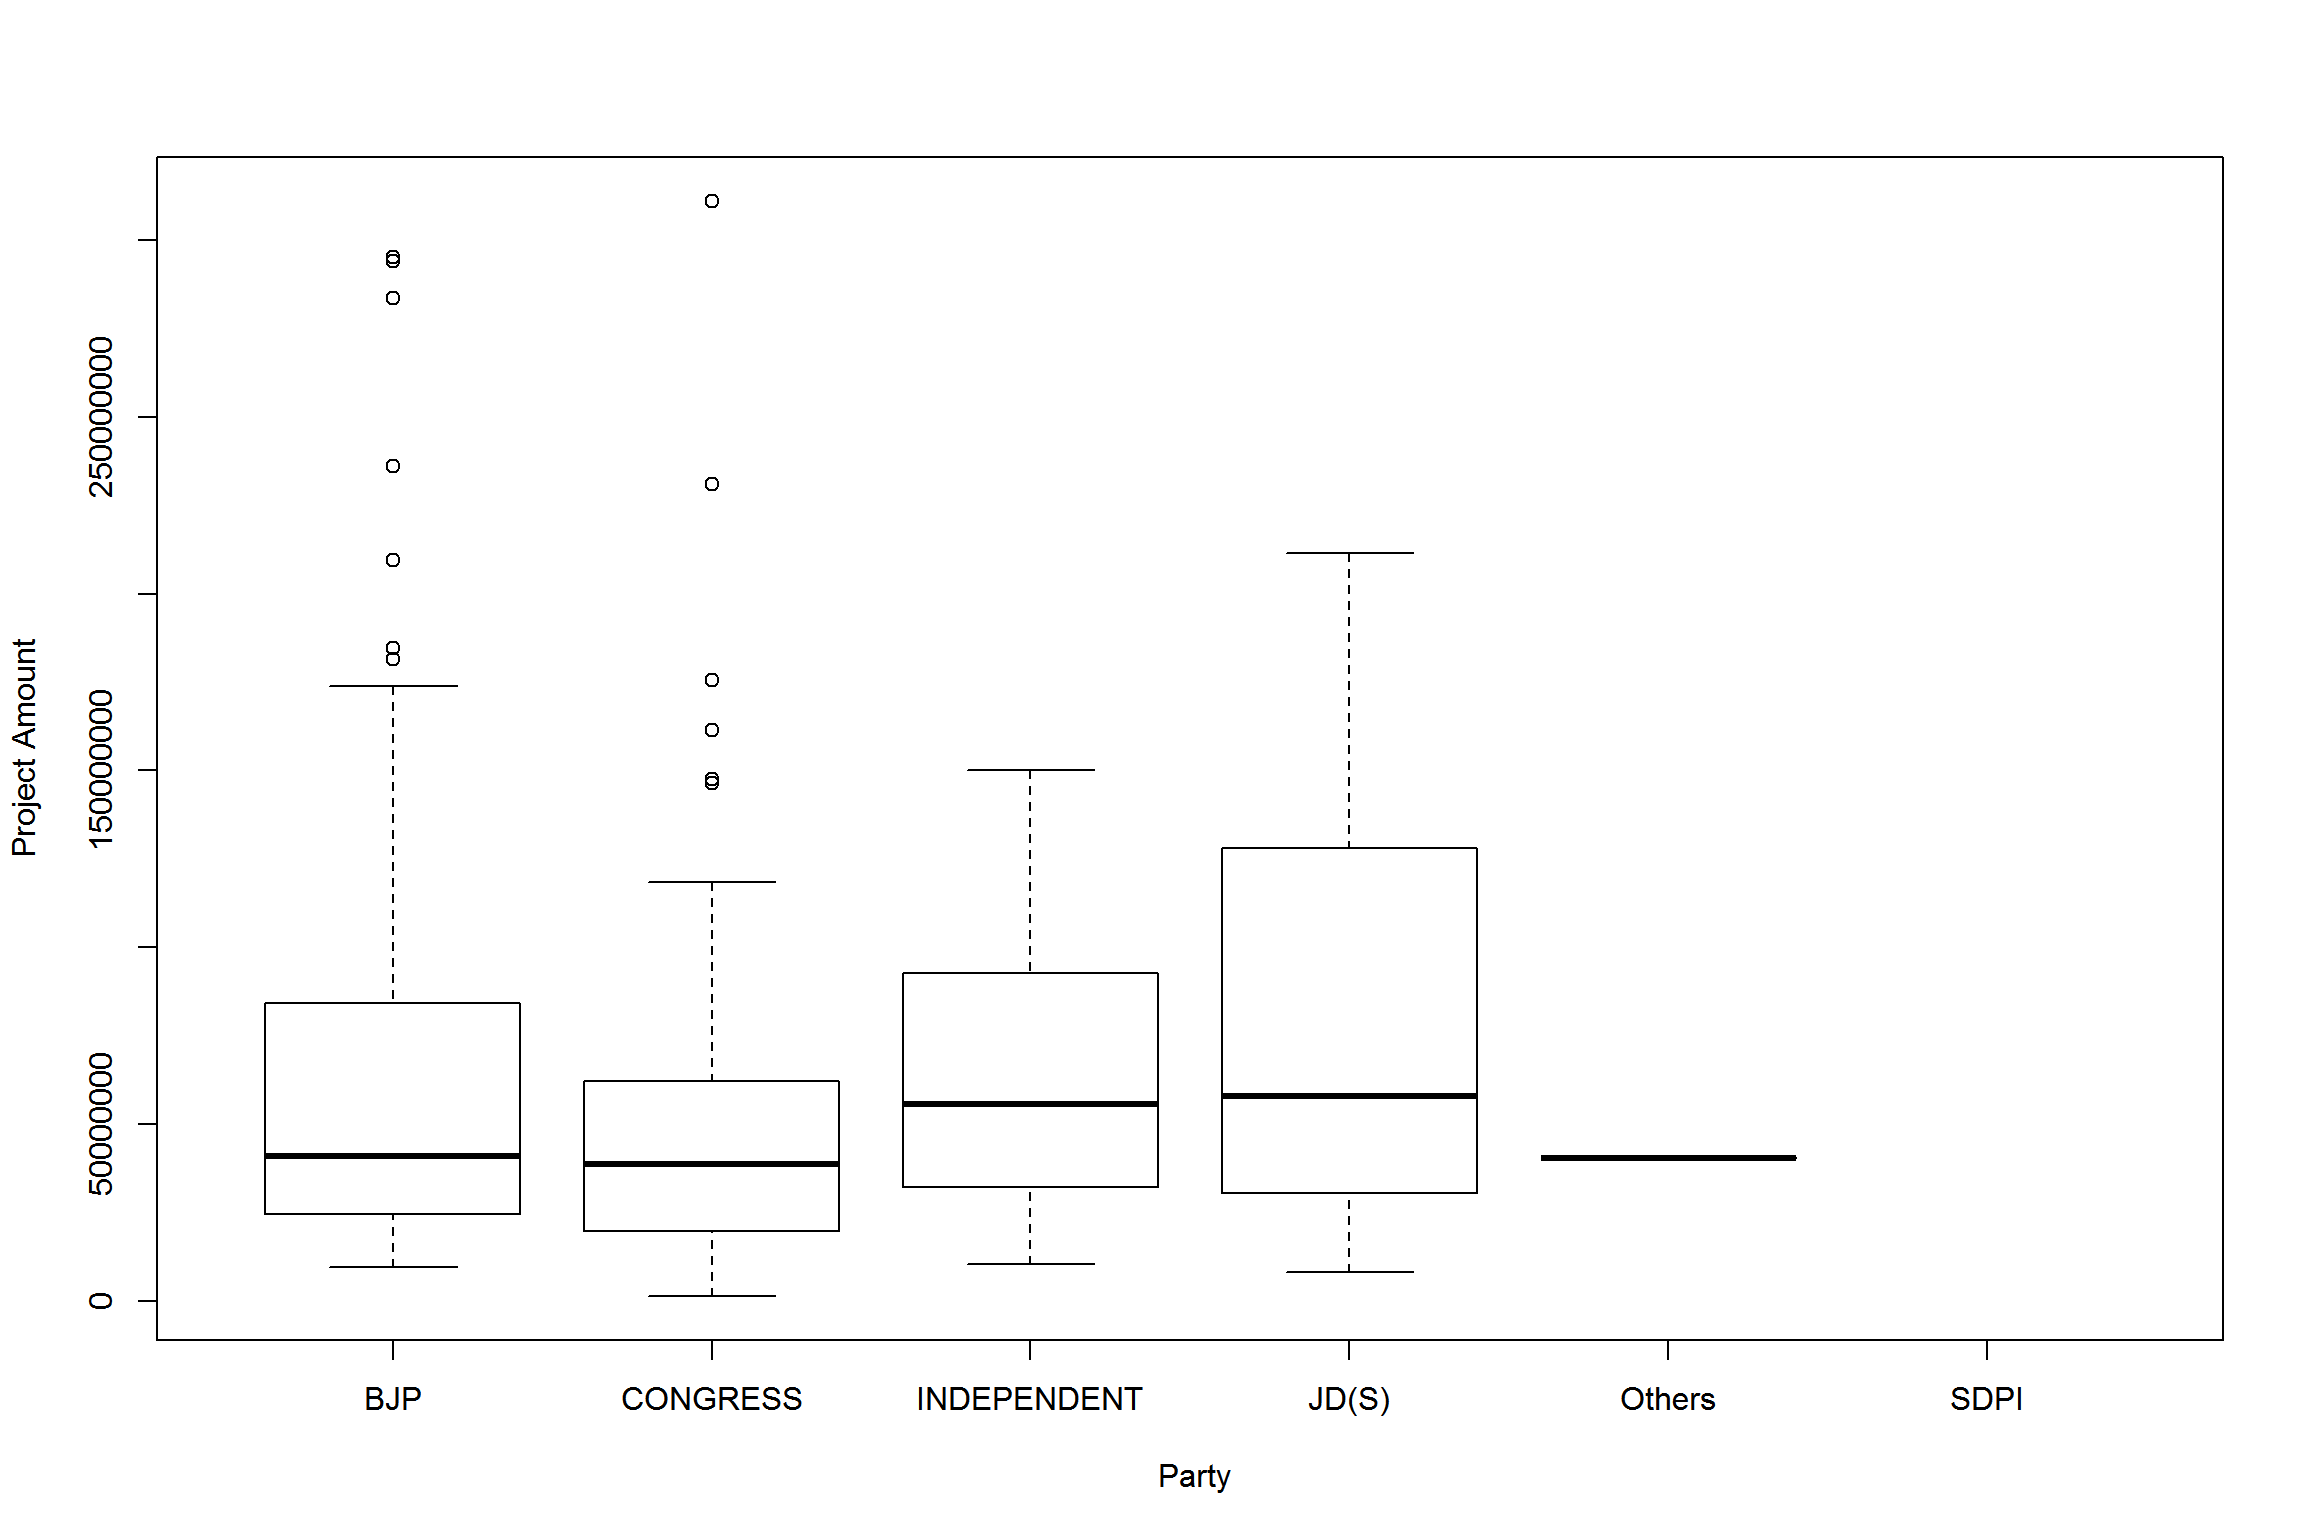
Recommended course of action.
A volunteer based orgranision spread across Bangalore can try doing a few informal ground survey to understand why did people vote for a given candidate,
- Was it his personal reputation,
- Was it the party,
- Was it money-muscle power,
- Why did some independents win and others did not?
- Why did JD(S) which projects itself as a rural party make inroads in the city core?
Opensource The code for this analysis is available at https://github.com/jahagirdar/elections/src/bbmp_2015.Rmd